A presentation at Meilleur Dev de France 2018 in in Paris, France by Horacio Gonzalez
Monitoring OVH 300k servers, 27 DCs... and one Metrics platform Horacio Gonzalez Kevin Georges Steven Le Roux @LostInBrittany @0xd33d33 @StevenLeRoux Monitoring @ovh
Who are we? Introducing ourselves and introducing OVH Monitoring @ovh
Horacio Gonzalez @LostInBrittany Spaniard lost in Brittany, developer, dreamer and all-around geek Monitoring @ovh
Kevin Georges @0xd33d33 Engineering Manager Working on Observability and Kubernetes Distributed system addict Warp10 / HBase / HDFS / Zookeeper / ETCD / Kubernetes Monitoring @ovh
Steven Le Roux @StevenLeRoux Principal Engineer From networking to Distributed Unconventional life rider Monitoring @ovh
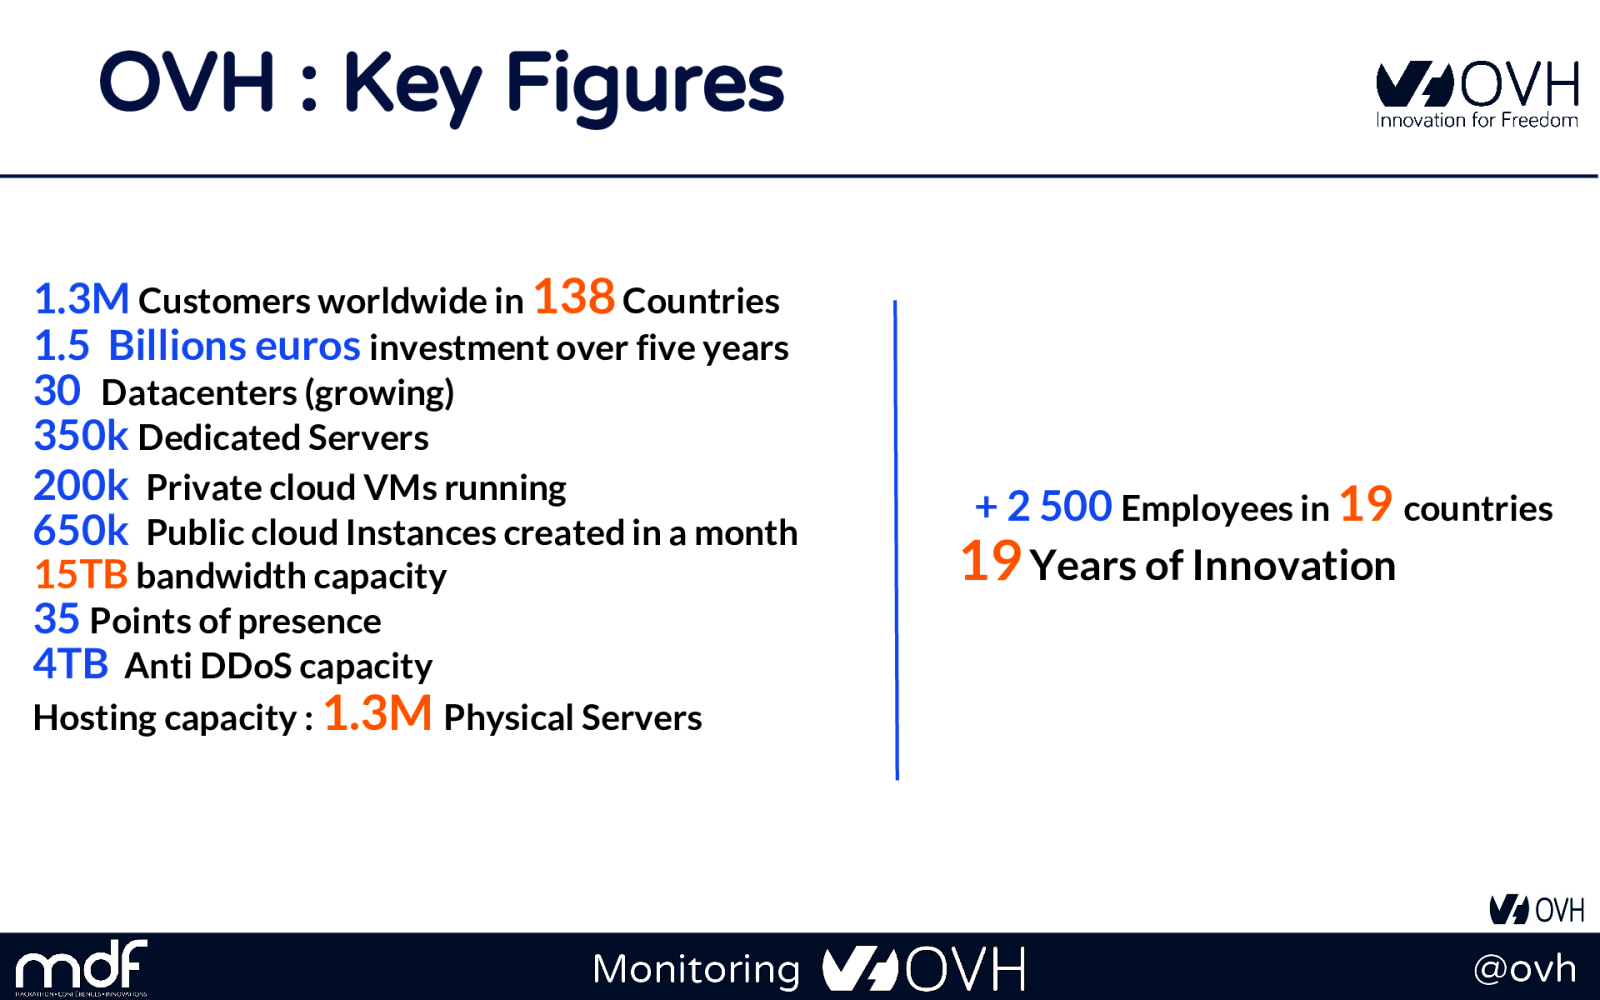
OVH : Key Figures 1.3M Customers worldwide in 138 Countries 1.5 Billions euros investment over five years 30 Datacenters (growing) 350k Dedicated Servers 200k Private cloud VMs running 650k Public cloud Instances created in a month 15TB bandwidth capacity
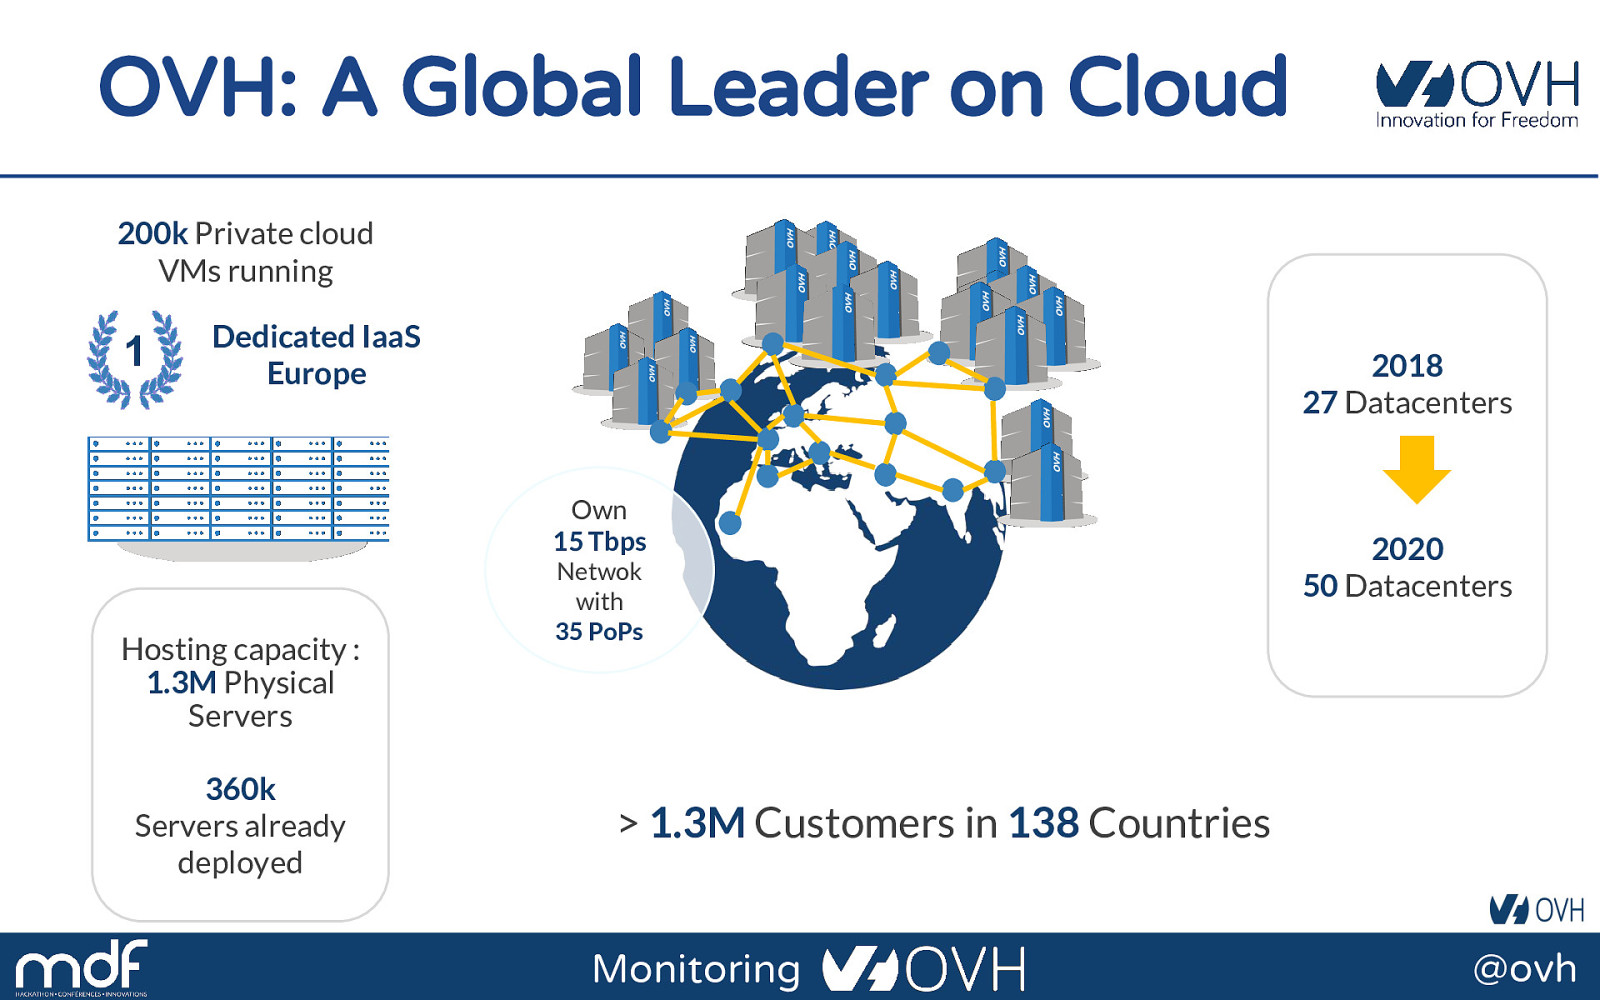
OVH: A Global Leader on Cloud 200k Private cloud VMs running 1 Dedicated IaaS Europe 2018 27 Datacenters Own 15 Tbps Hosting capacity : 1.3M Physical Servers 360k Servers already deployed Netwok with 35 PoPs 2020 50 Datacenters
1.3M Customers in 138 Countries Monitoring @ovh
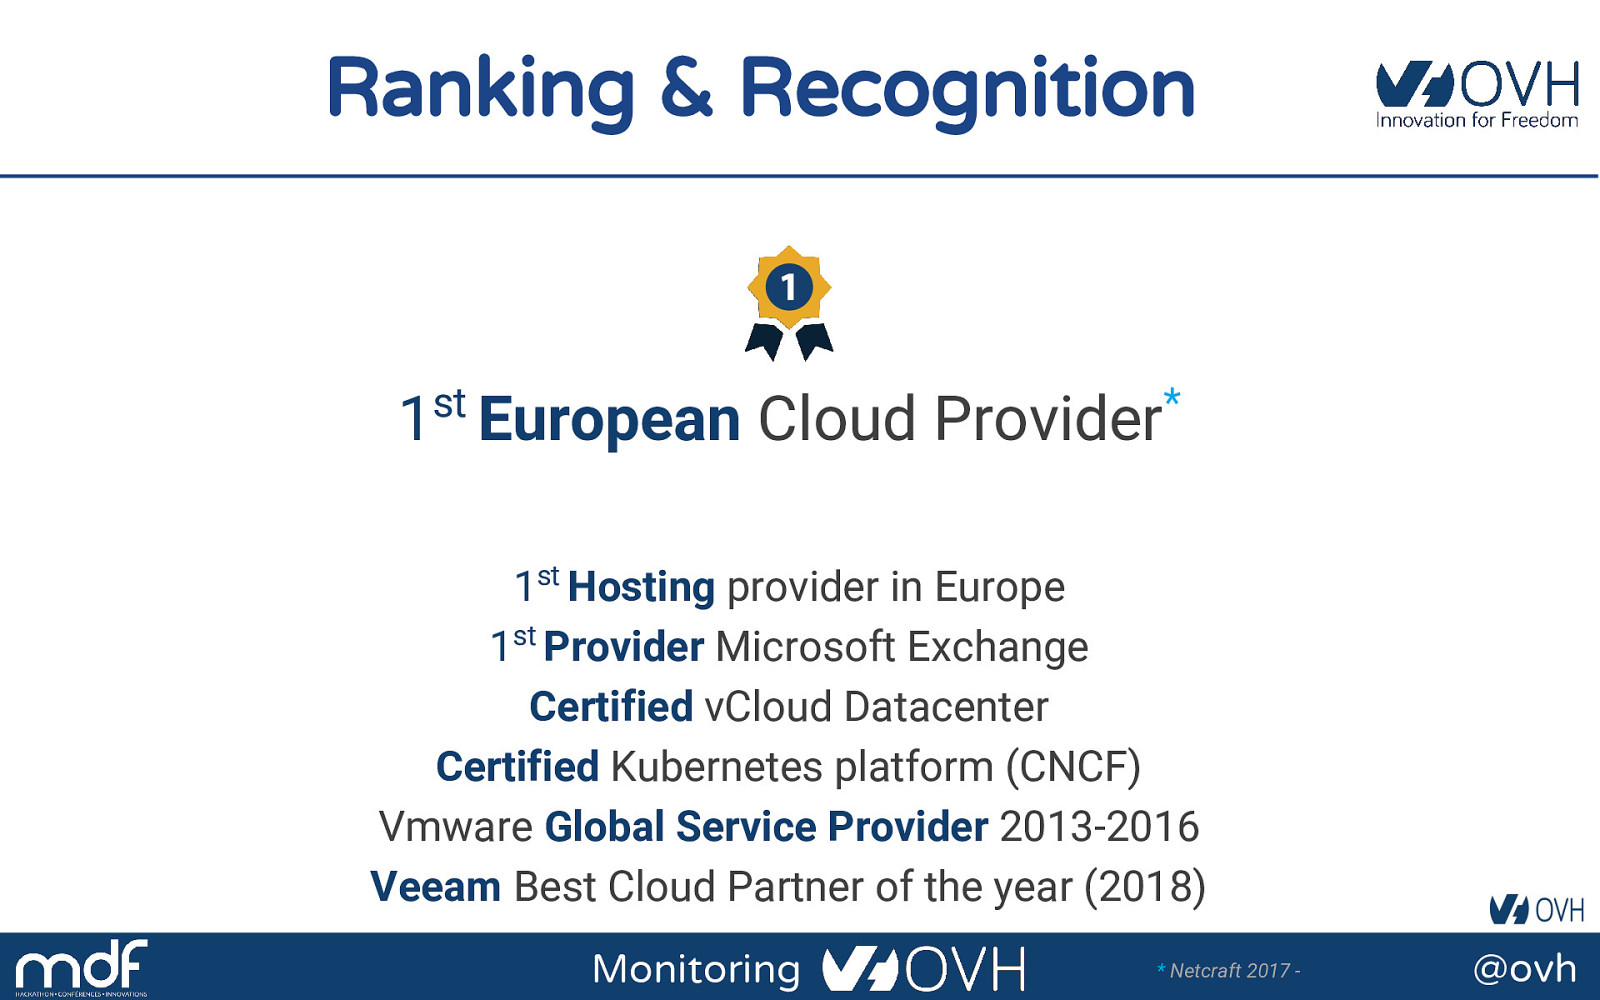
Ranking & Recognition 1st European Cloud Provider* 1st Hosting provider in Europe 1st Provider Microsoft Exchange Certified vCloud Datacenter Certified Kubernetes platform (CNCF) Vmware Global Service Provider 2013-2016 Veeam Best Cloud Partner of the year (2018) Monitoring
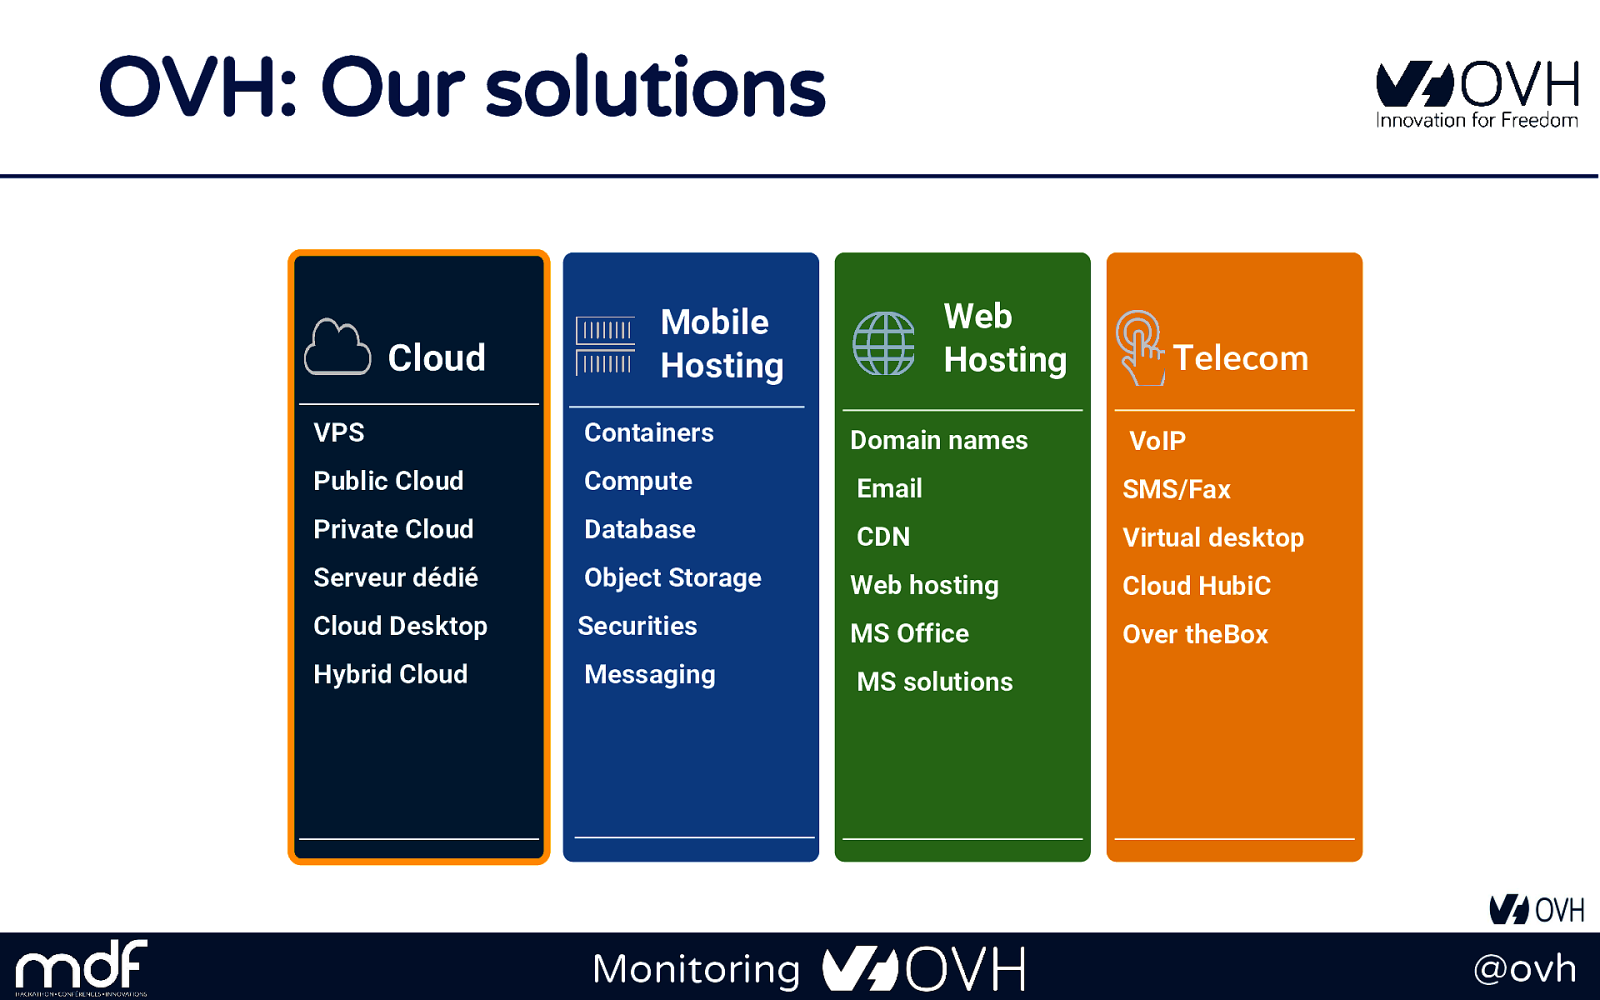
OVH: Our solutions Cloud Web Hosting Mobile Hosting Telecom VPS Containers ▪ Dedicated Server Domain names VoIP Public Cloud Compute ▪ Data Storage Email SMS/Fax Private Cloud ▪ Network and Database CDN Virtual desktop Serveur dédié Security Object Storage Web hosting Cloud HubiC Over theBox ▪ Licences Cloud Desktop Securities MS Office Hybrid Cloud Messaging MS solutions Monitoring @ovh
Once upon a time... Because we love telling tales Monitoring @ovh
This talk is about a tale... A true one nevertheless Monitoring @ovh
And as in most tales It begins with a mission Monitoring @ovh
And a band of heroes Engulfed into the adventure Monitoring @ovh
They fight against mishaps And all kind of foes Monitoring @ovh
They build a mighty citadel Pushing the limits of Physics Monitoring @ovh
And defend them day after day Against all odds Monitoring @ovh
But we don't know yet the end Because this tale isn't finished yet Monitoring @ovh
It begins with a mission Build a metrics platform for OVH Monitoring @ovh
It began with a mission Build a metrics platform for OVH Monitoring @ovh
Why do we need metrics? To make better decisions by using numbers Monitoring @ovh
Why do we need metrics? We need to make better decisions about our code Monitoring @ovh
Why do we need metrics? We want our code to add value Monitoring @ovh
Why do we need metrics? Code adds value when it runs not when we write it Monitoring @ovh
Why do we need metrics? We need to know what our code does when it runs Monitoring @ovh
Why do we need metrics? We can’t do this unless we measure it Monitoring @ovh
Why do we need metrics? We have a mental model of what our code does Monitoring @ovh
Why do we need metrics? This representation can be wrong Monitoring @ovh
Why do we need metrics? We can’t know until we measure it Monitoring @ovh
Find the bottleneck ‘’ “The app is slow.” - User Monitoring @ovh
Find the bottleneck ‘’ “The app is slow.” - User “The page takes 500ms!” - Ops Monitoring @ovh
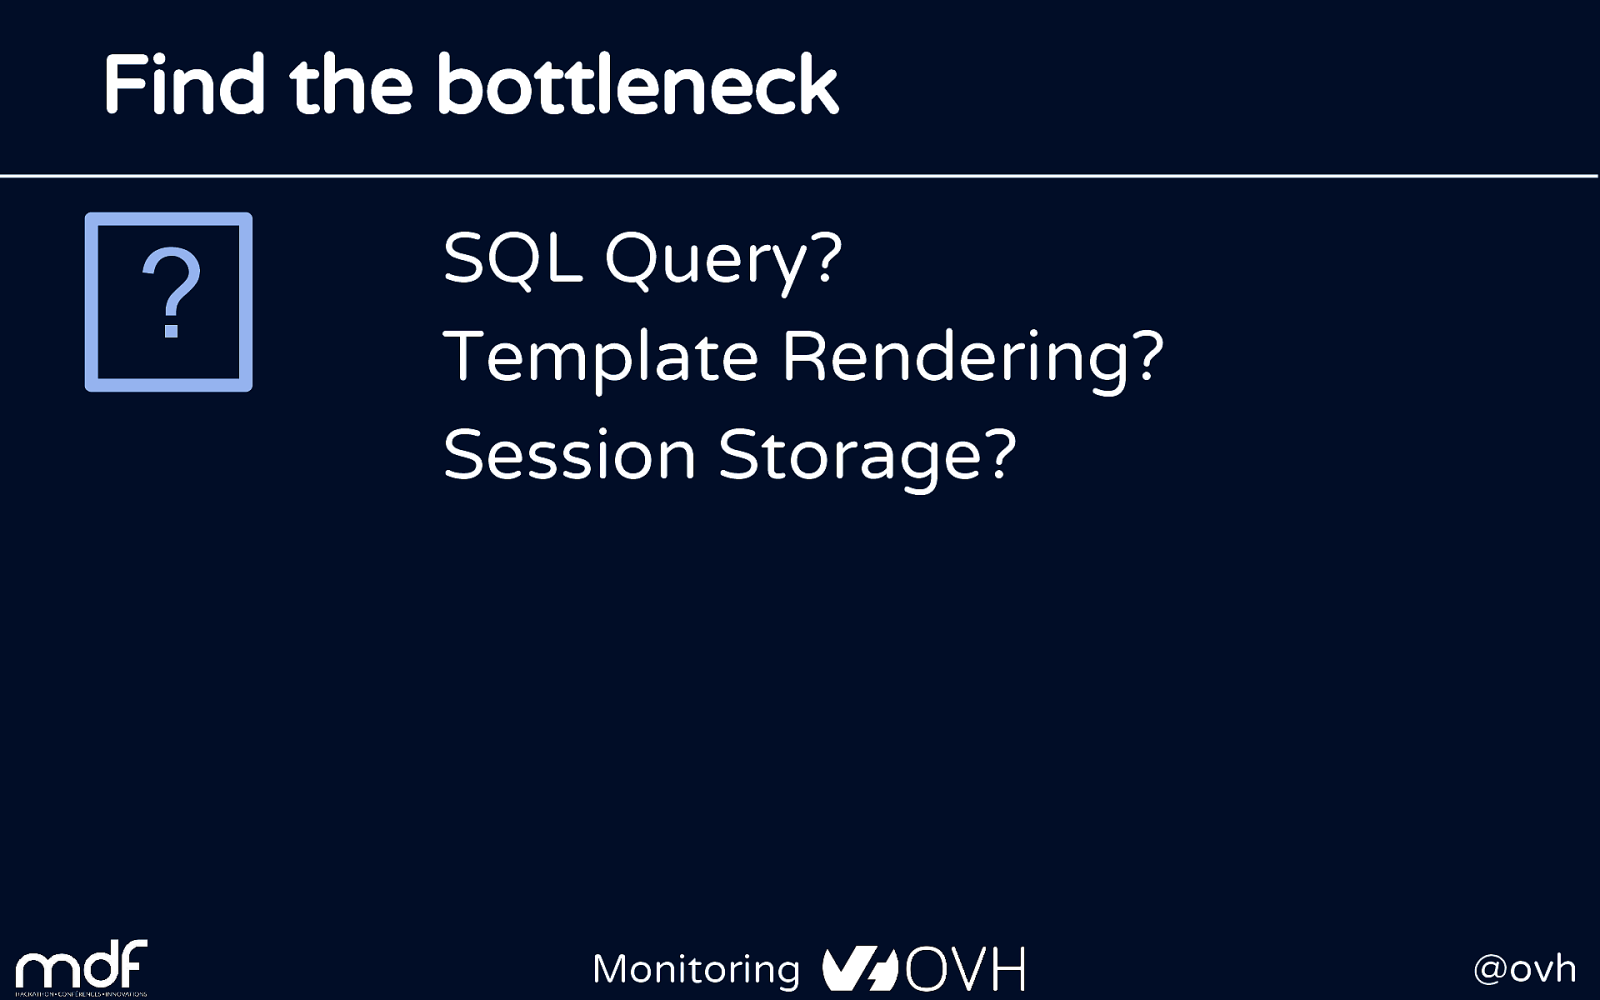
Find the bottleneck ? SQL Query? Template Rendering? Session Storage? Monitoring @ovh
Find the bottleneck ? We don't know Monitoring @ovh
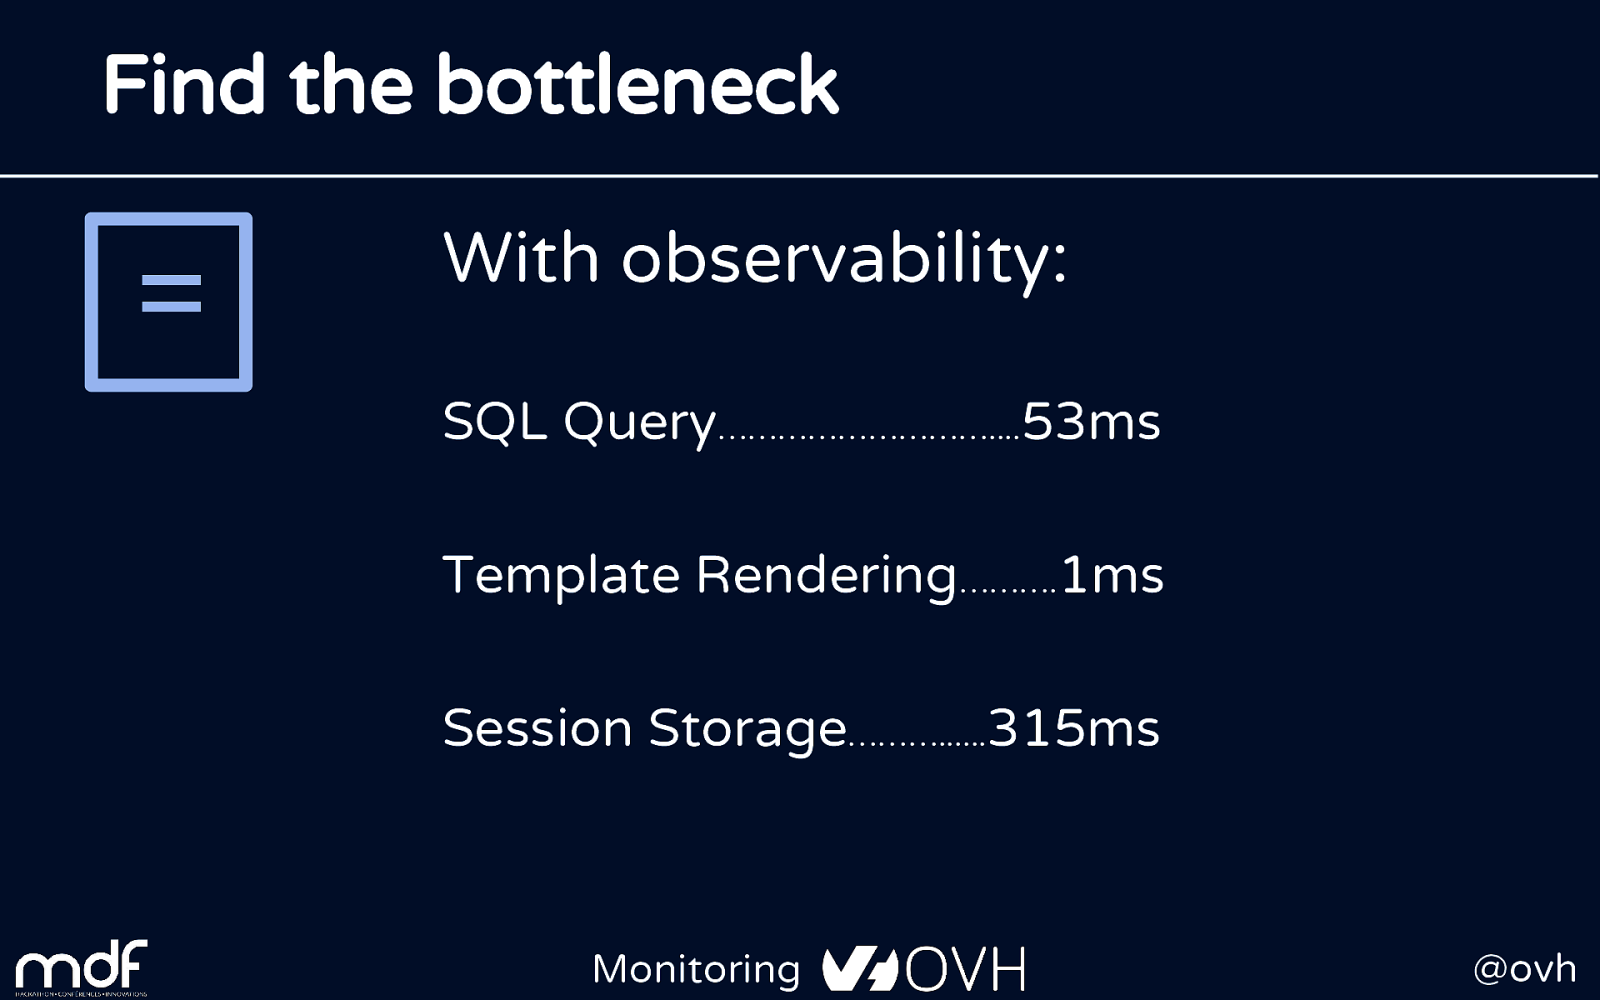
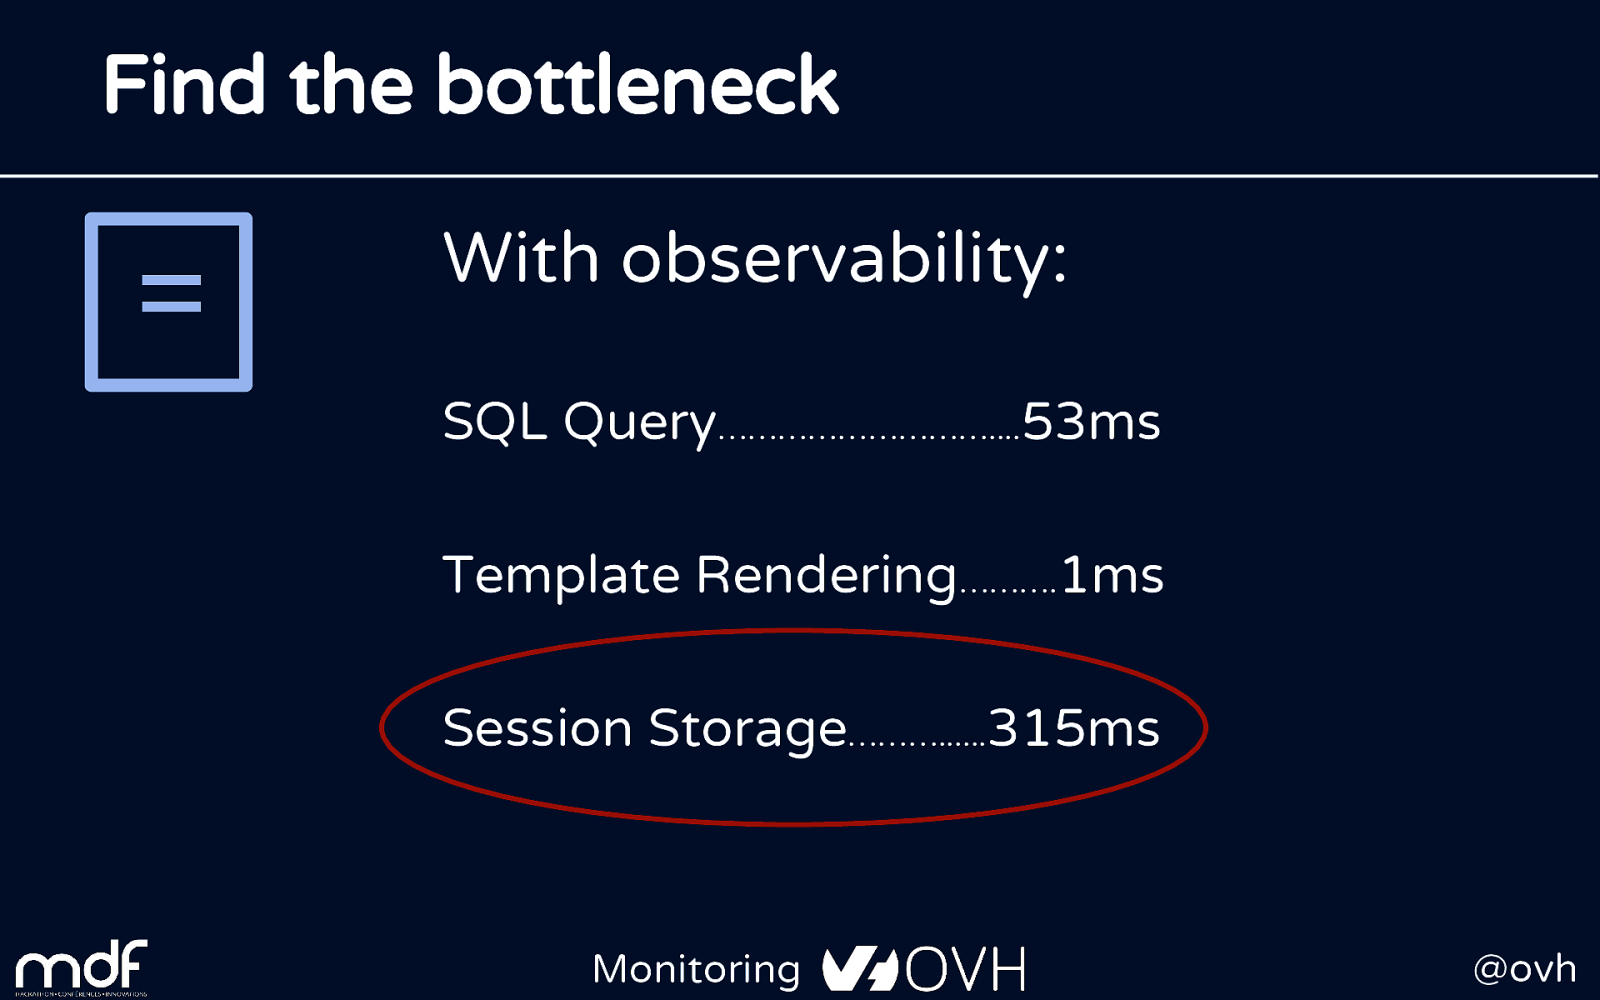
With observability: SQL Query………………………....53ms Template Rendering……….1ms Session Storage………......315ms Monitoring @ovh
With observability: SQL Query………………………....53ms Template Rendering……….1ms Session Storage………......315ms Monitoring @ovh
Why do we need metrics? We improve our mental model by measuring what our code does Monitoring @ovh
Why do we need metrics? We use our mental model to decide what to do Monitoring @ovh
Why do we need metrics? A better mental model makes us better at deciding what to do Monitoring @ovh
Why do we need metrics? Better decisions makes us better at generating value Monitoring @ovh
Why do we need metrics? Measuring make your App better Monitoring @ovh
It began with a mission Build a metrics platform for OVH Monitoring @ovh
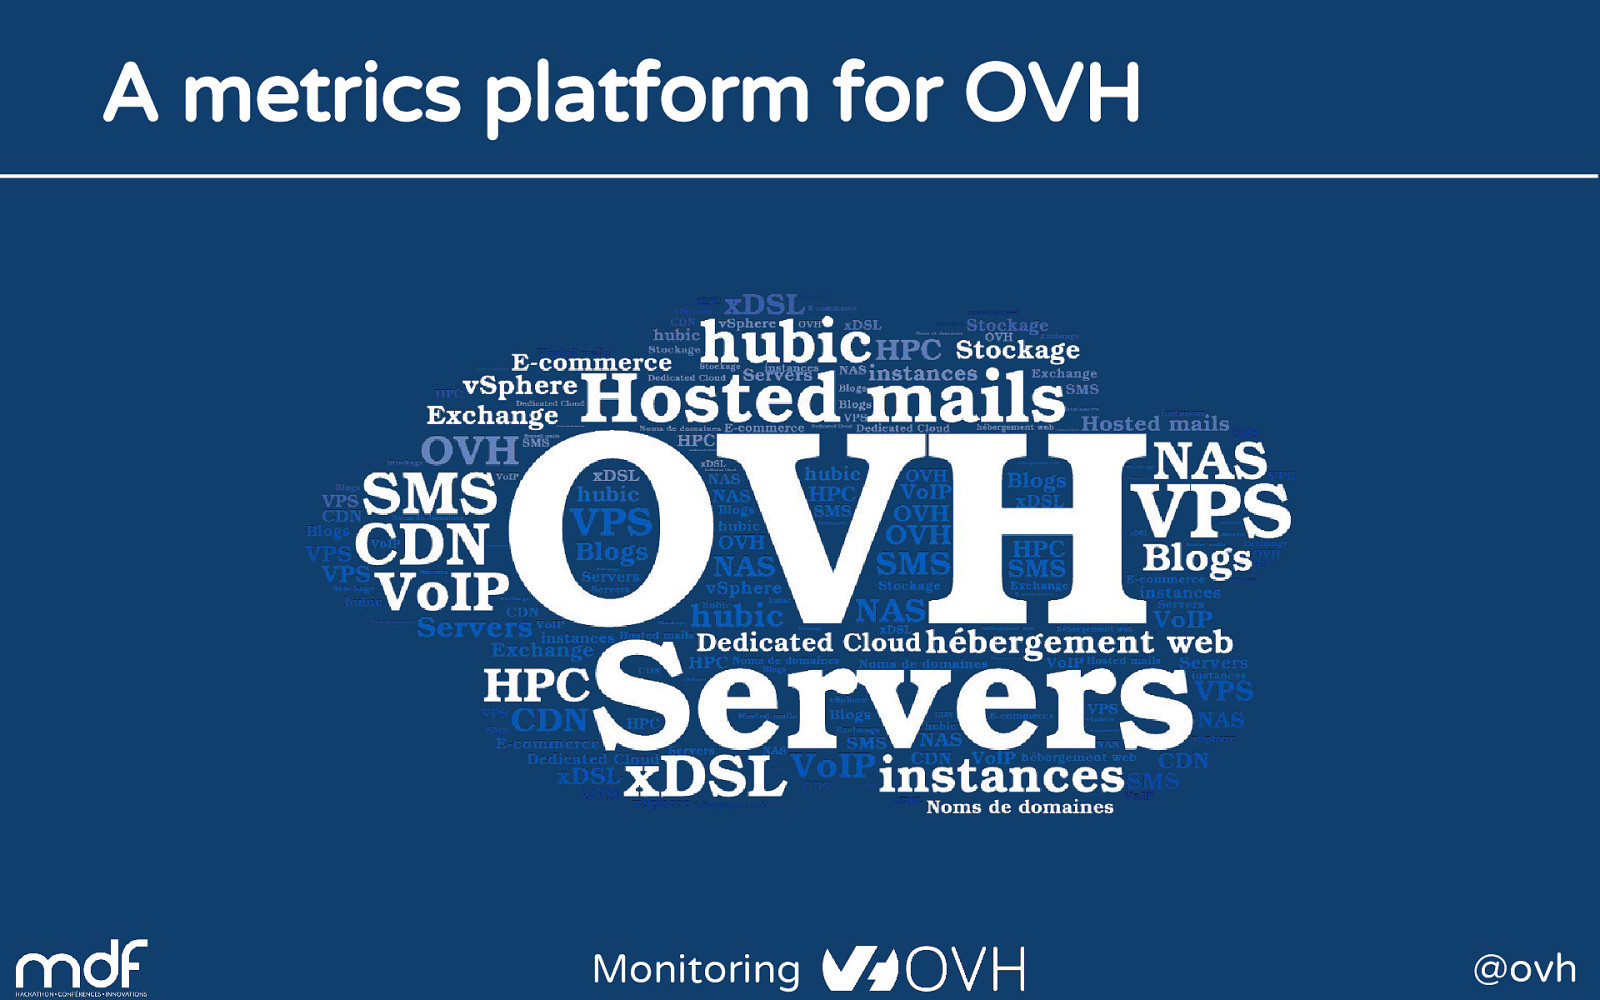
A metrics platform for OVH Monitoring @ovh
Building OVH Metrics One Platform to unify them all, One Platform to find them, One Platform to bring them all and in the Metrics monitor them Monitoring @ovh
What is OVH Metrics? Managed Cloud Platform for Time Series Monitoring @ovh
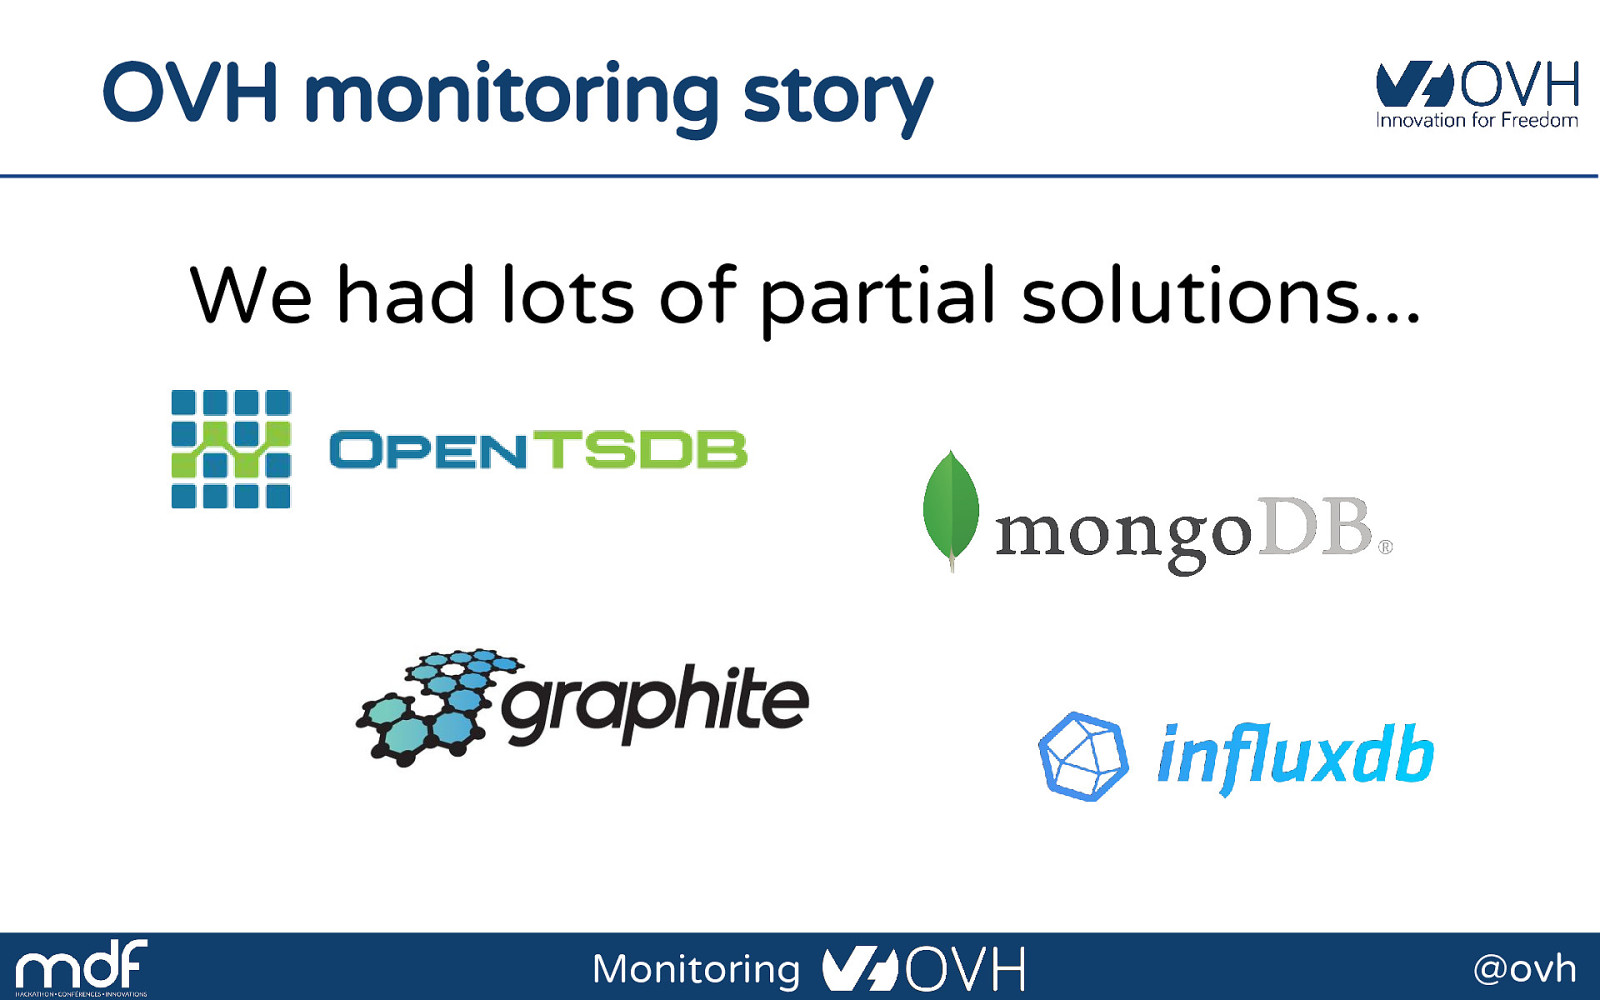
OVH monitoring story We had lots of partial solutions... Monitoring @ovh
OVH monitoring story One Platform to unify them all What should we build it on? Monitoring @ovh
OVH monitoring story First try Monitoring @ovh
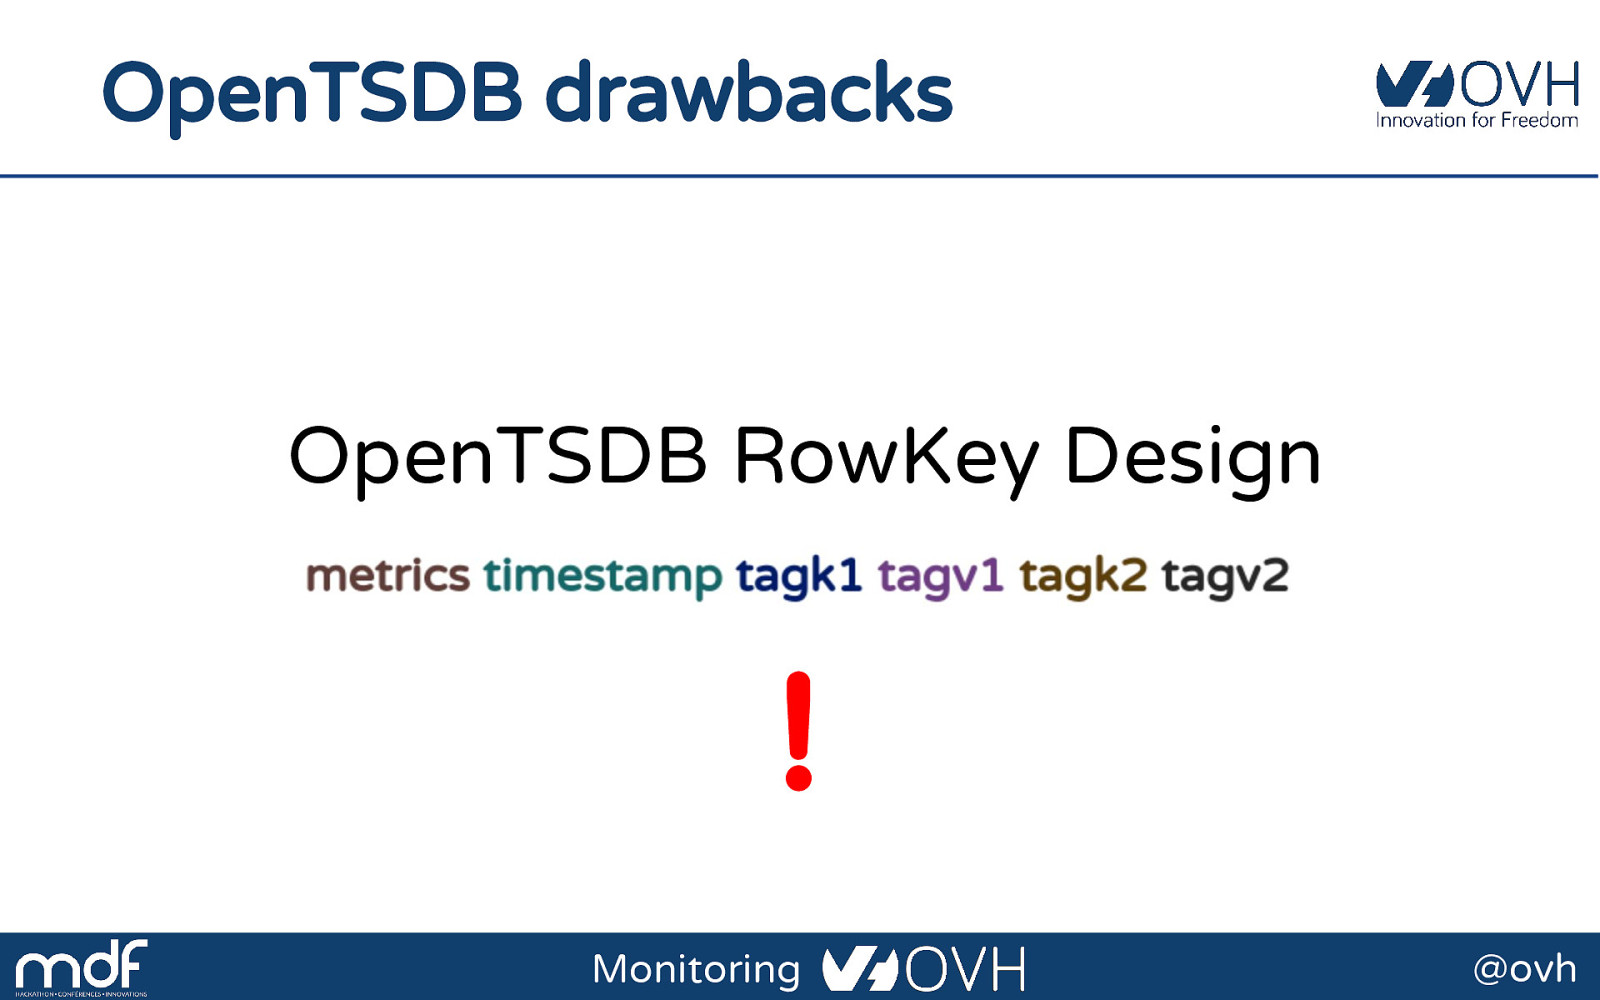
OpenTSDB drawbacks OpenTSDB RowKey Design ! Monitoring @ovh
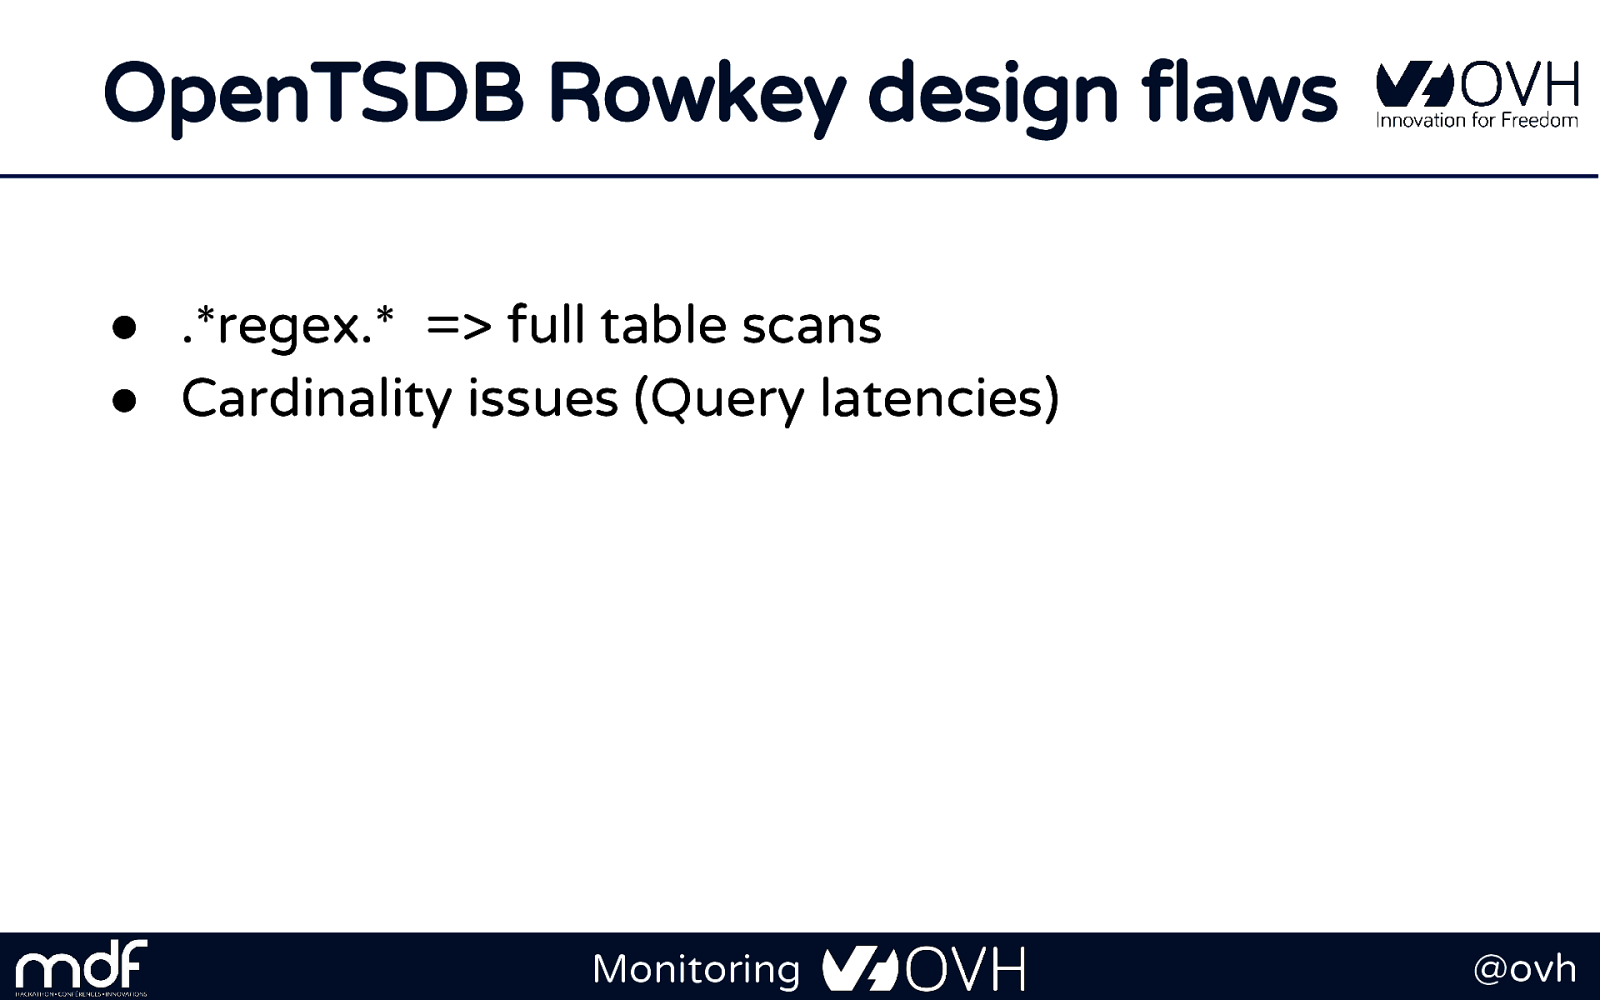
OpenTSDB Rowkey design flaws ● .regex. => full table scans ● Cardinality issues (Query latencies) Monitoring @ovh
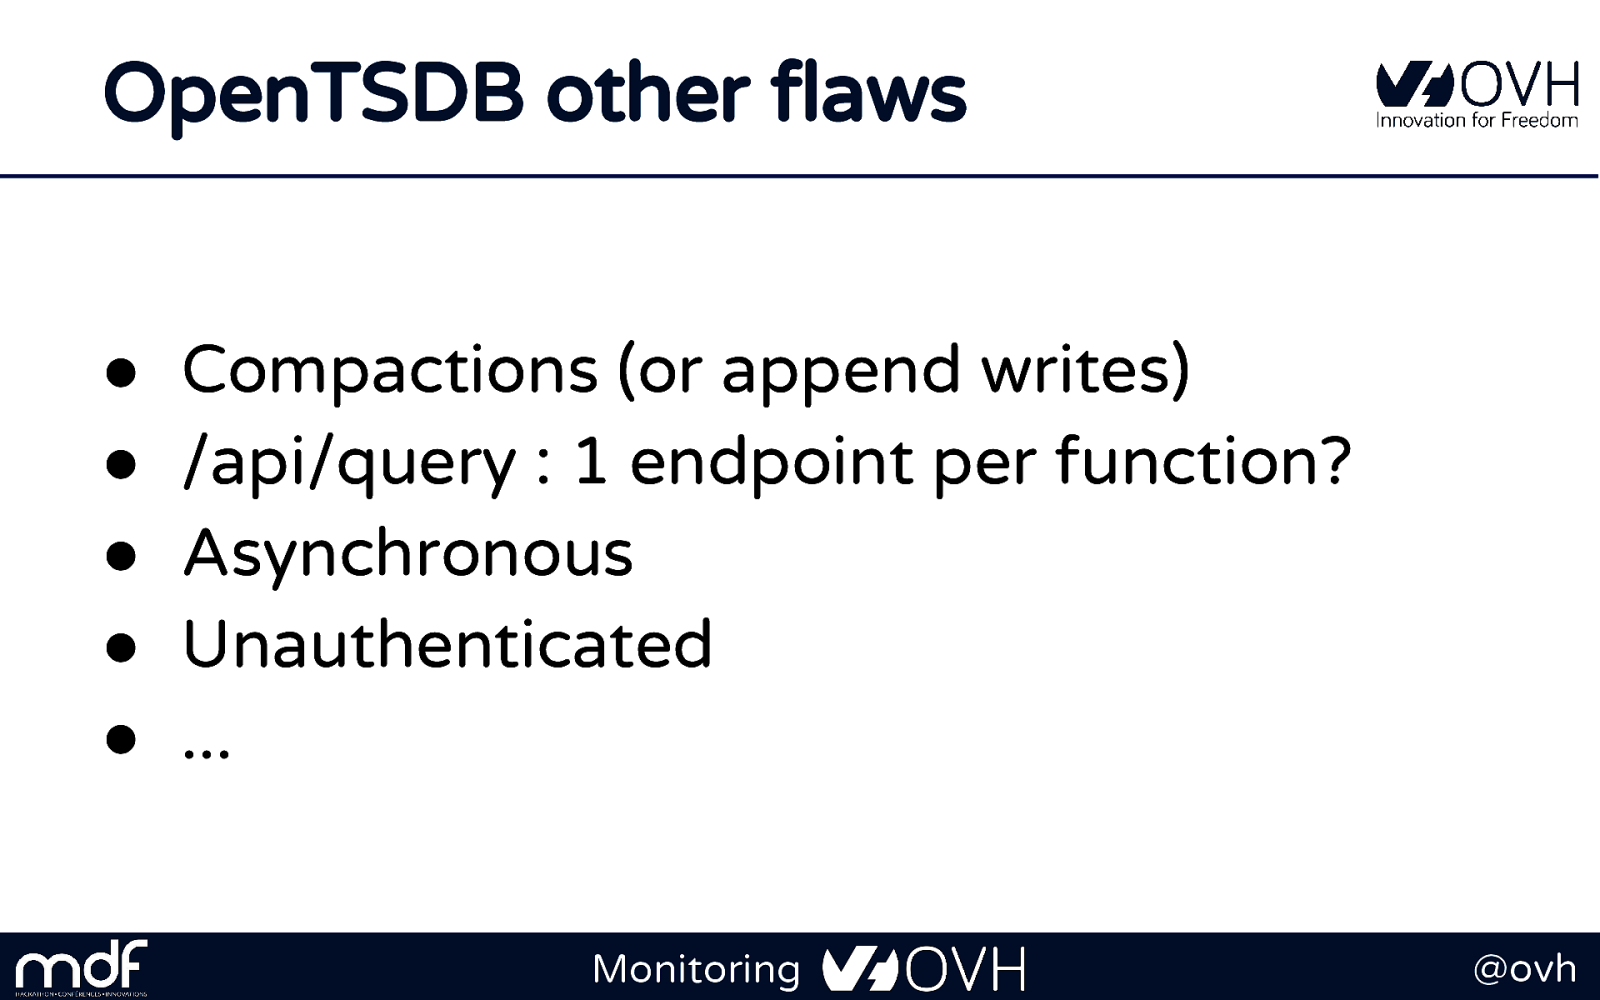
OpenTSDB other flaws ● ● ● ● ● Compactions (or append writes) /api/query : 1 endpoint per function? Asynchronous Unauthenticated ... Monitoring @ovh
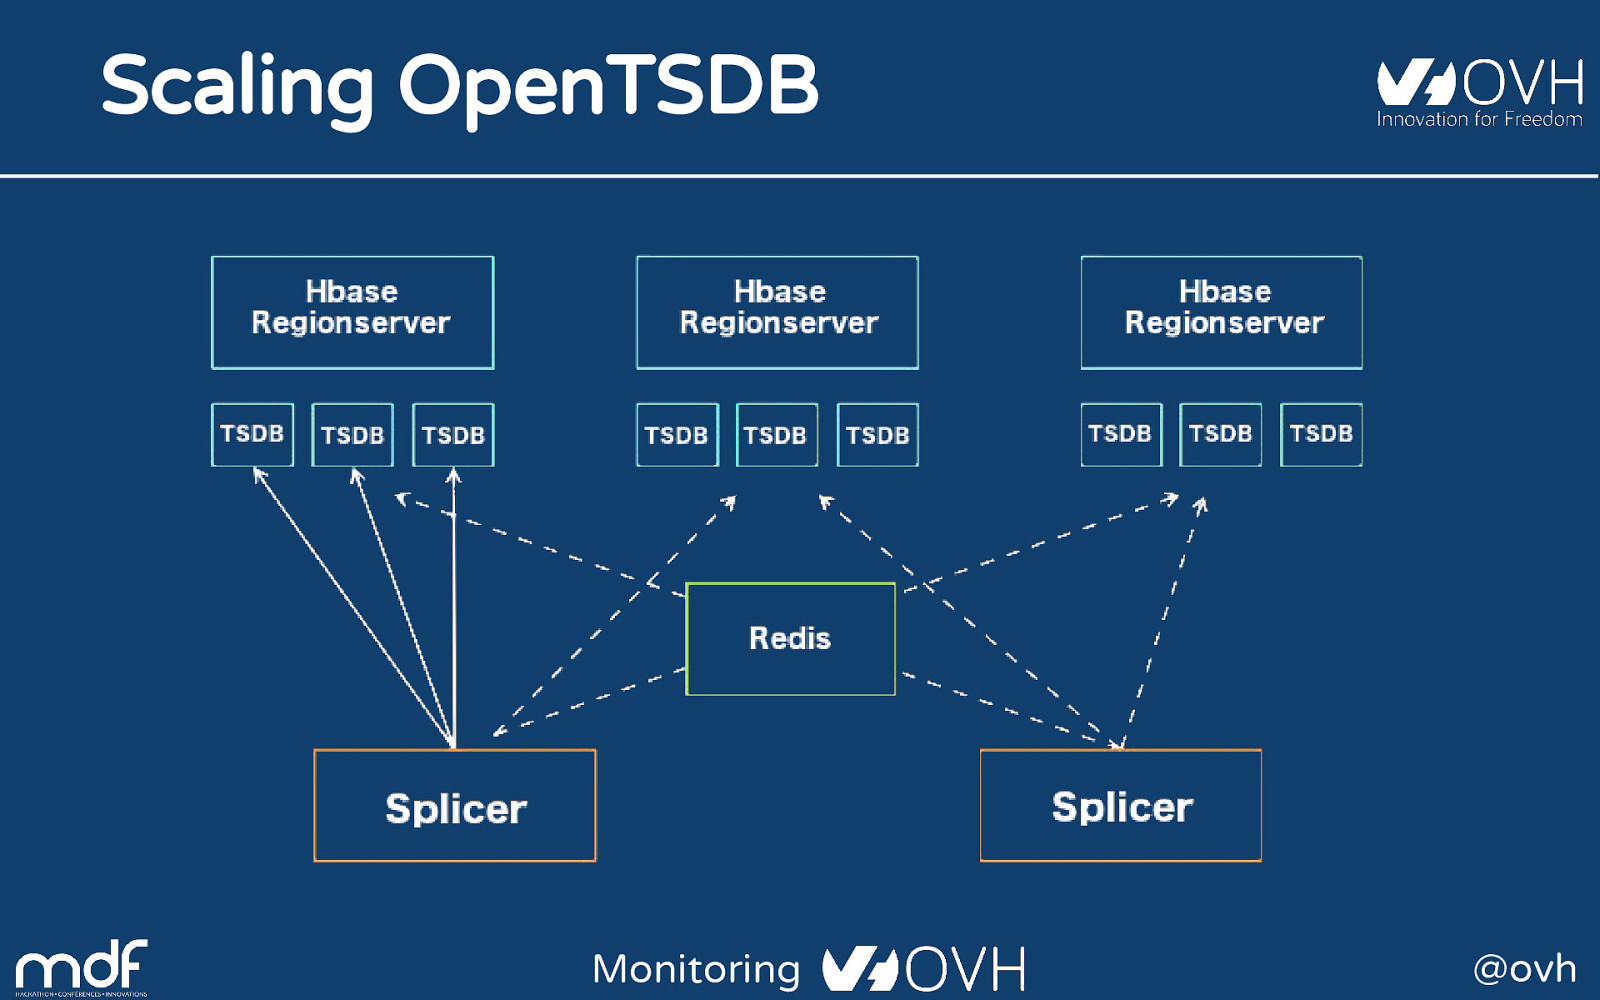
Scaling OpenTSDB Monitoring @ovh
Metrics needs First need: To be massively scalable Monitoring @ovh
Analytics is the key to success Fetching data is only the tip of the iceberg Monitoring @ovh
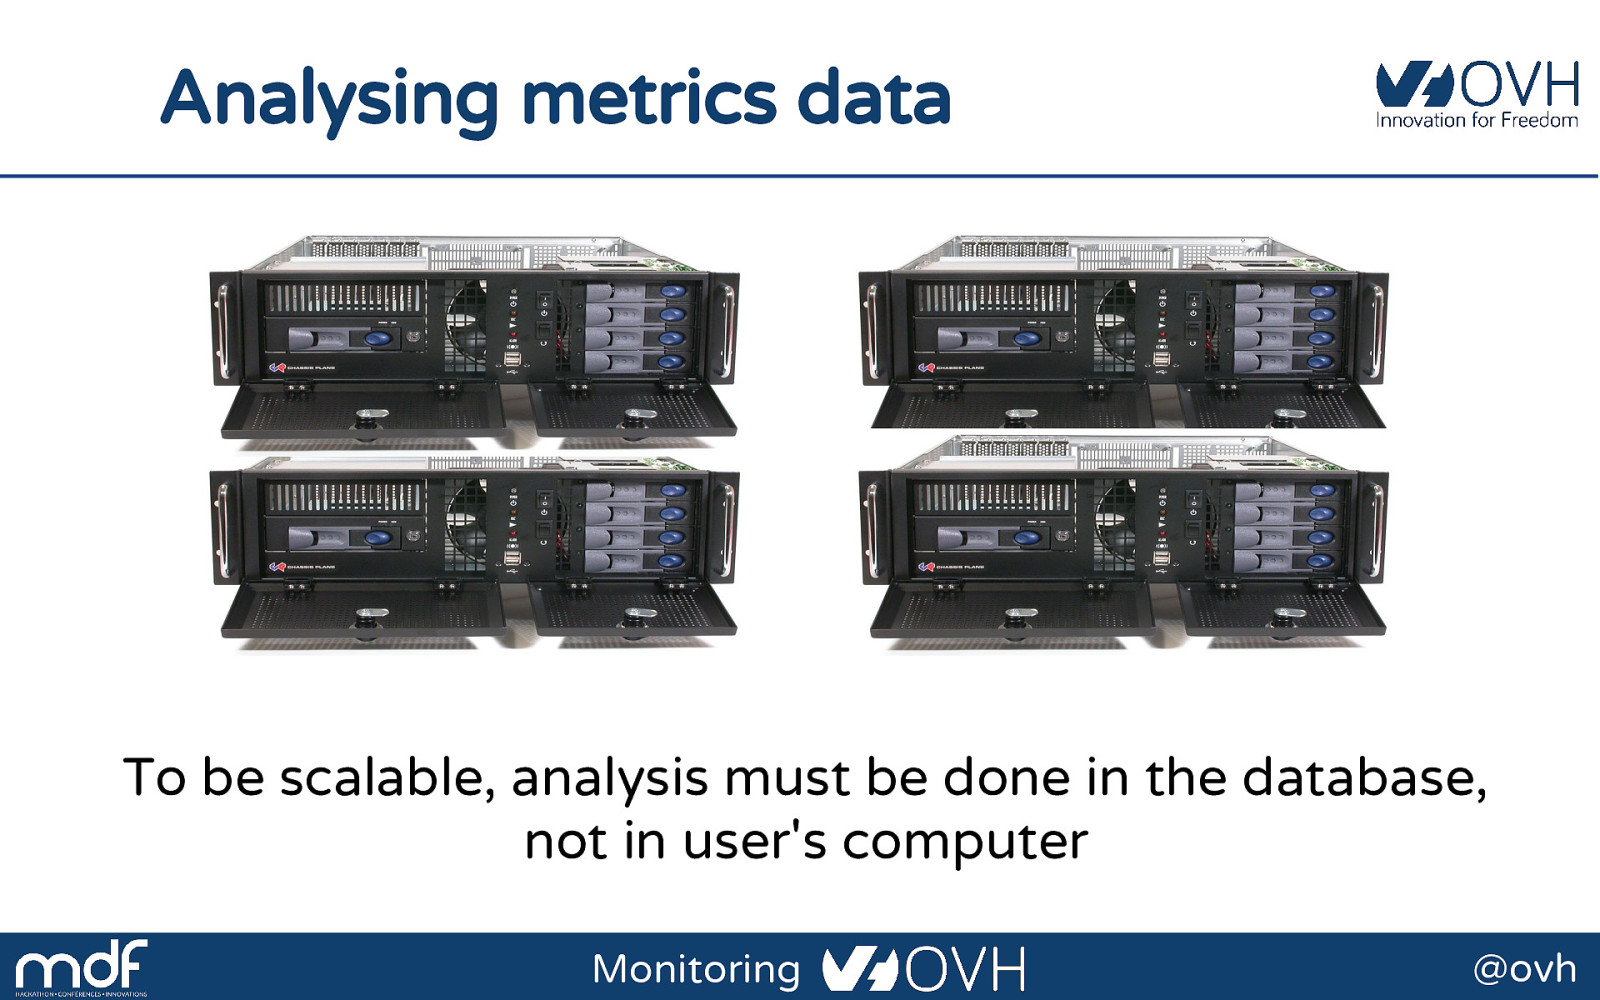
Analysing metrics data To be scalable, analysis must be done in the database, not in user's computer Monitoring @ovh
Metrics needs Second need: To have rich query capabilities Monitoring @ovh
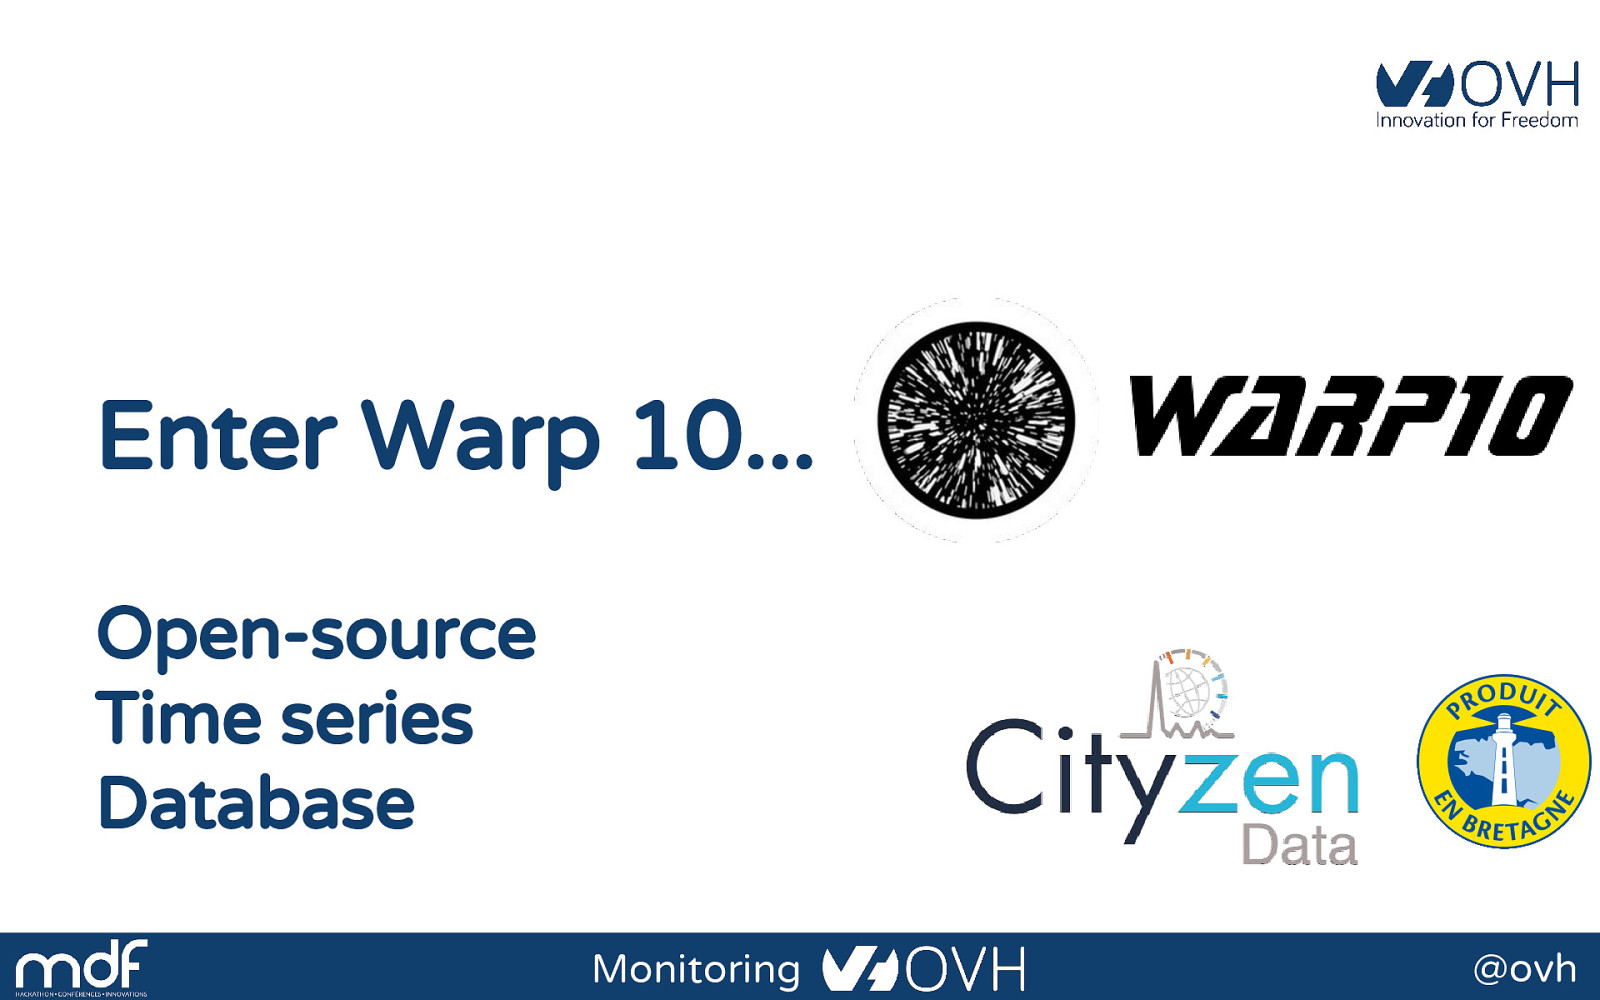
Enter Warp 10... Open-source Time series Database Monitoring @ovh
More than a Time Series DB Warp 10 is a software platform that ● Ingests and stores time series ● Manipulates and analyzes time series Monitoring @ovh
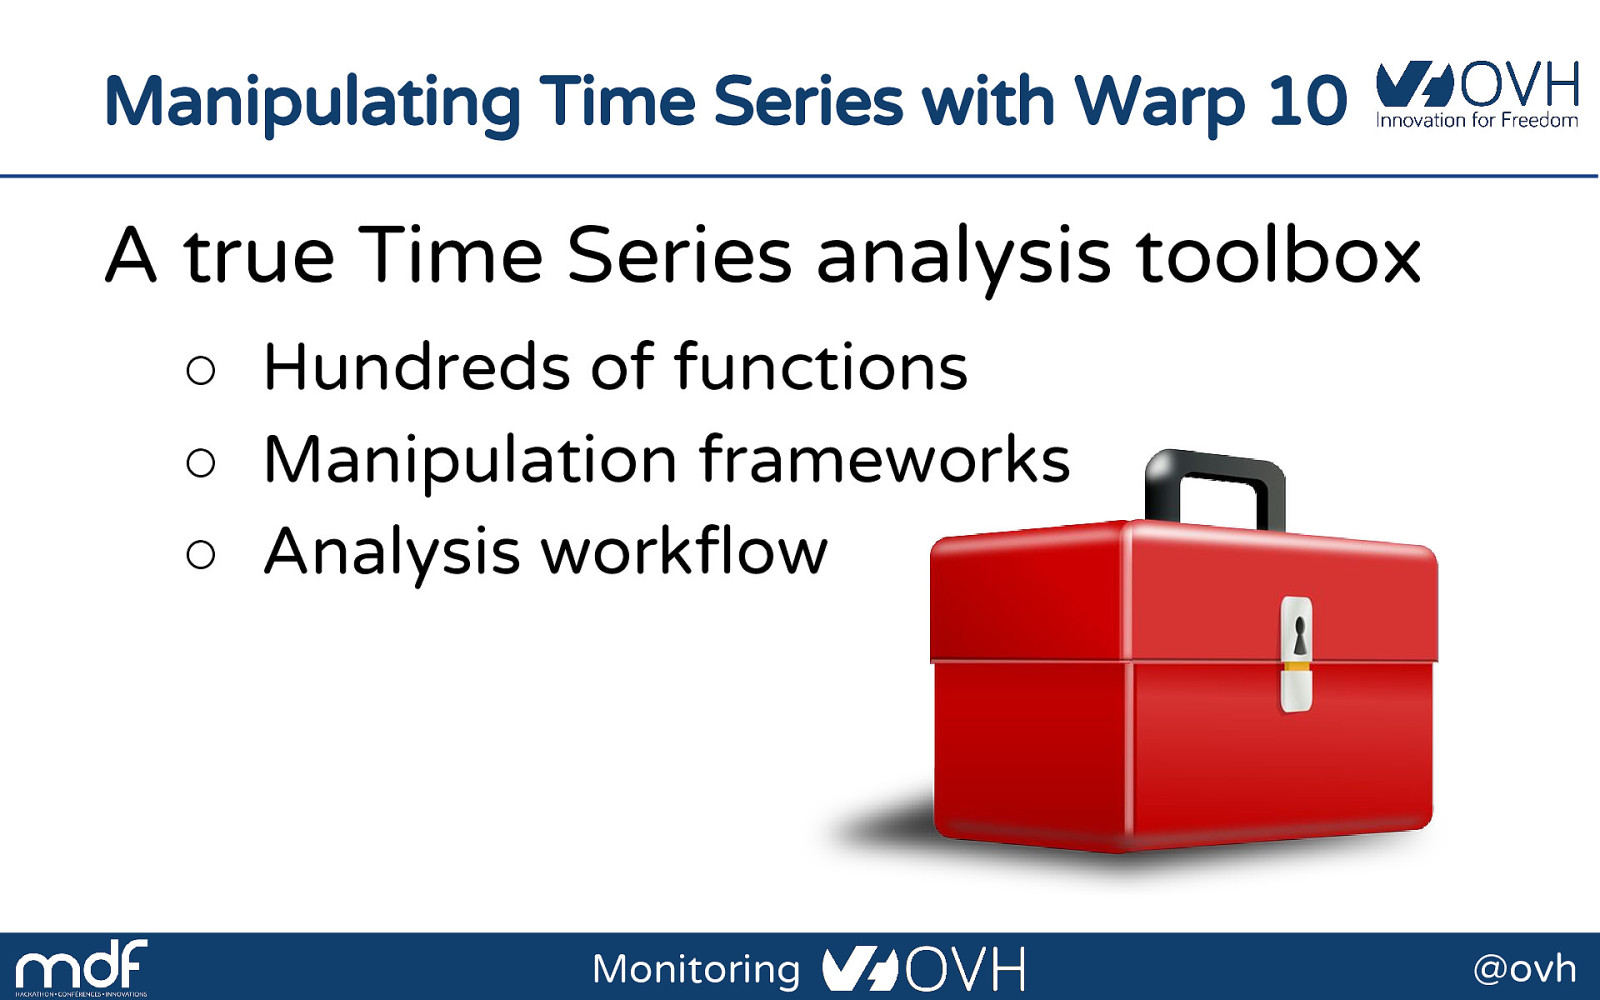
Manipulating Time Series with Warp 10 A true Time Series analysis toolbox ○ Hundreds of functions ○ Manipulation frameworks ○ Analysis workflow Monitoring @ovh
Manipulating Time Series with Warp 10 A Time Series manipulation language WarpScript Monitoring @ovh
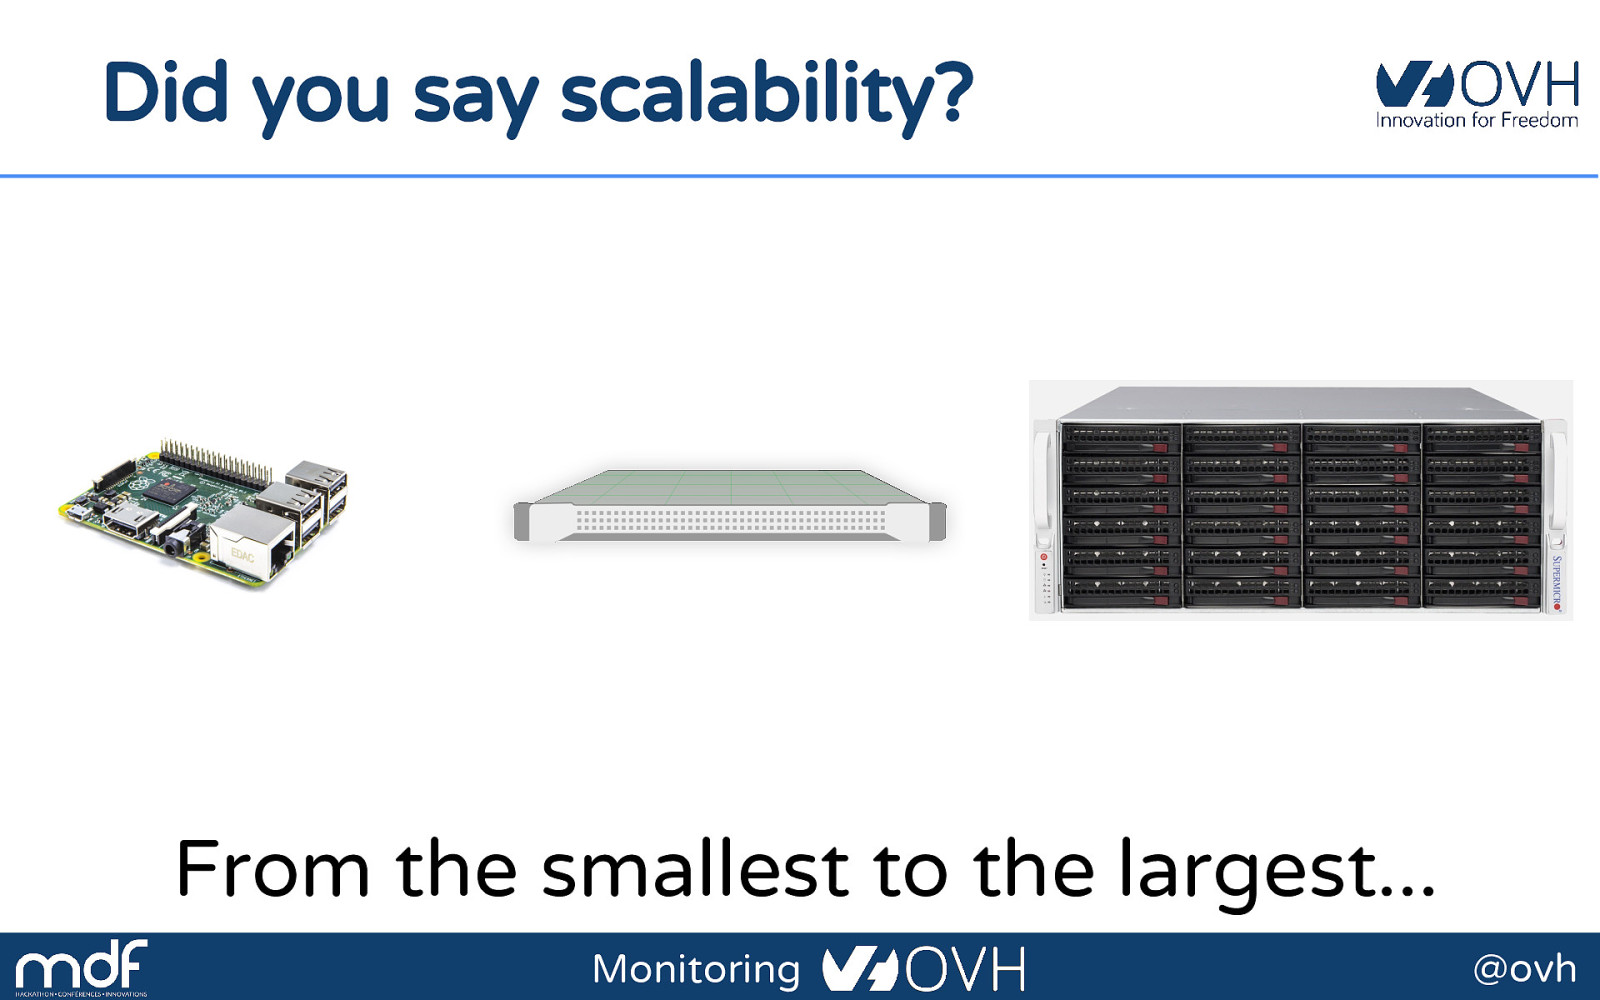
Did you say scalability? From the smallest to the largest... Monitoring @ovh
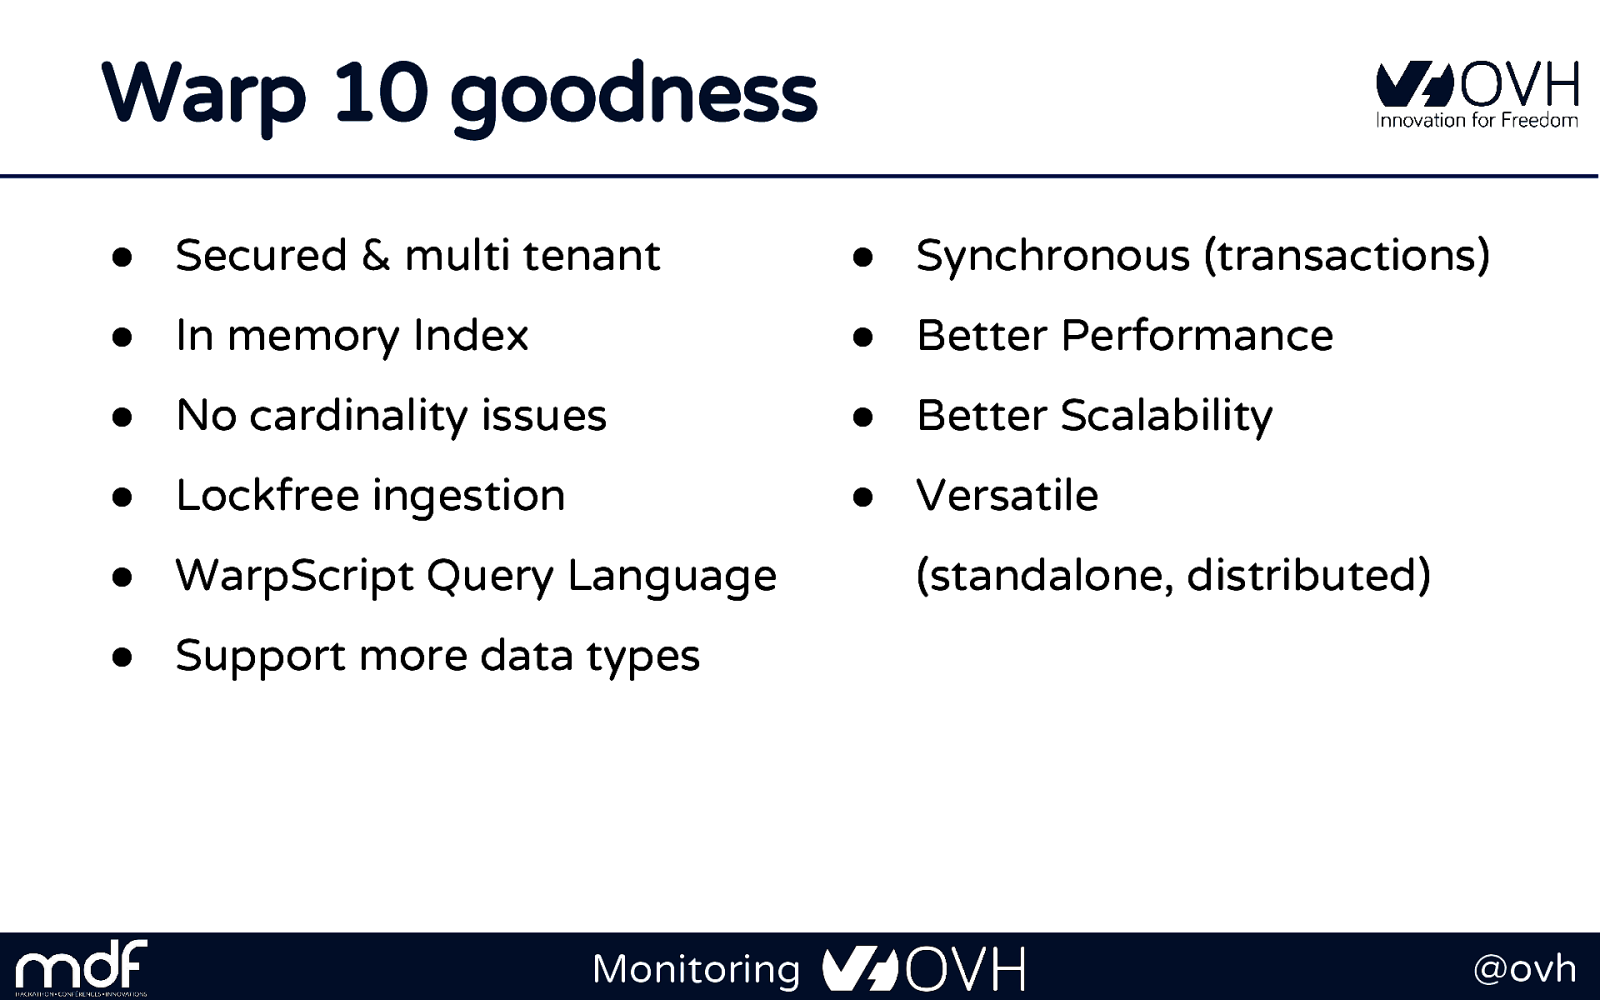
Warp 10 goodness ● Secured & multi tenant ● Synchronous (transactions) ● In memory Index ● Better Performance ● No cardinality issues ● Better Scalability ● Lockfree ingestion ● Versatile ● WarpScript Query Language (standalone, distributed) ● Support more data types Monitoring @ovh
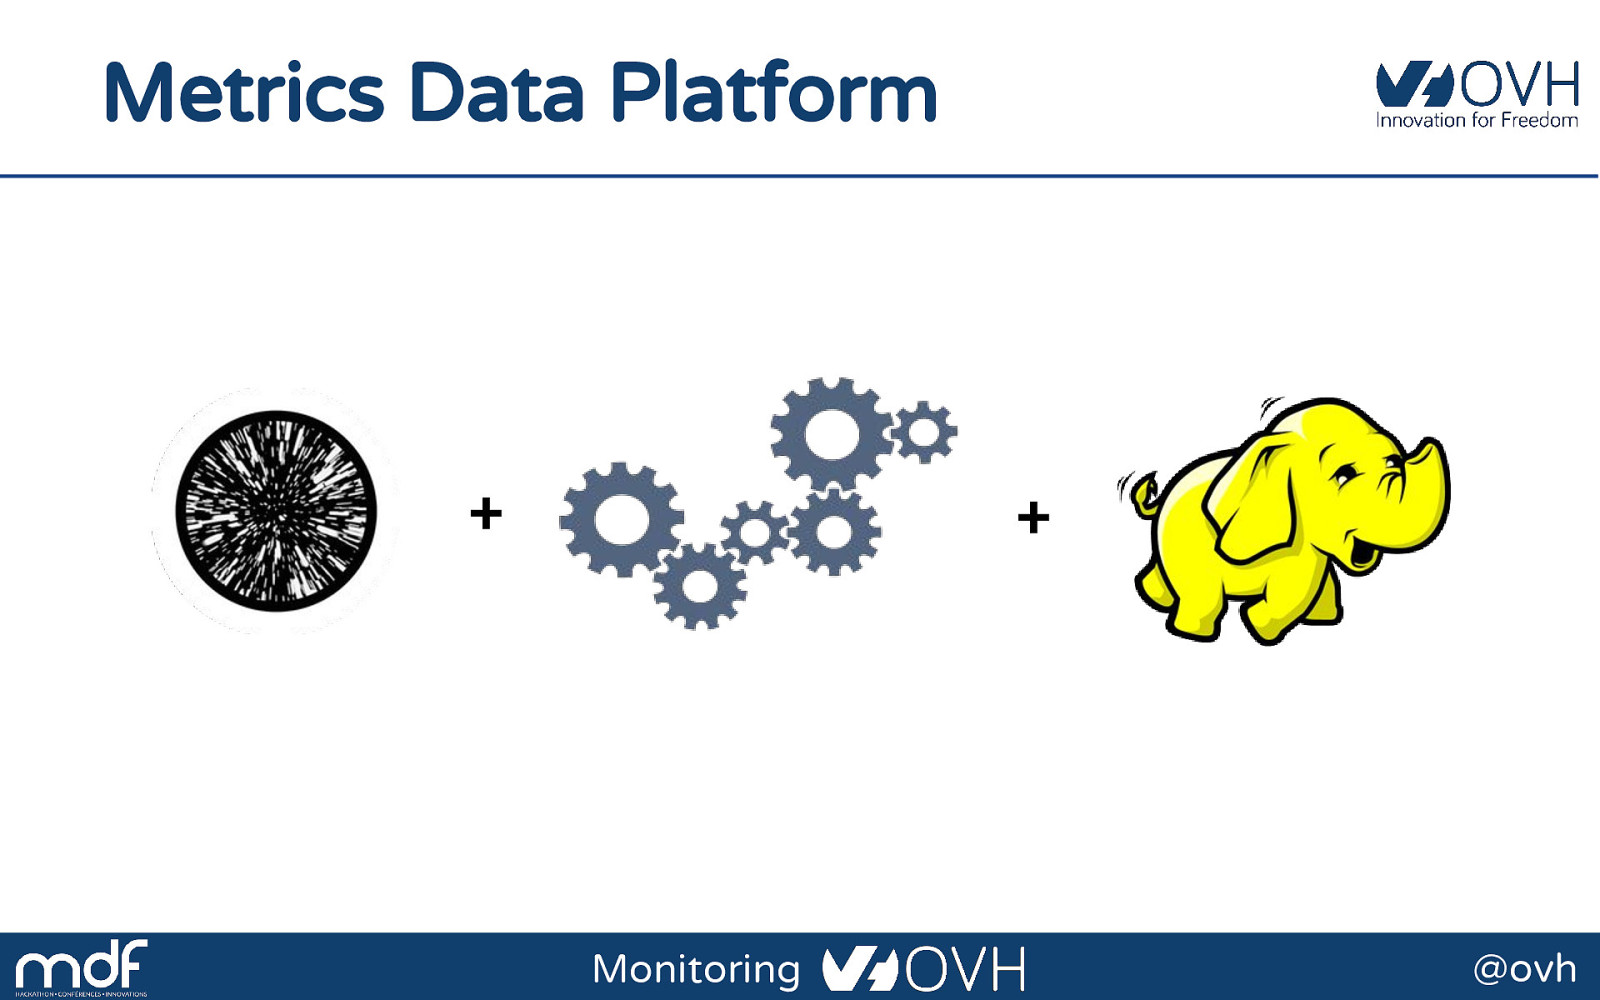
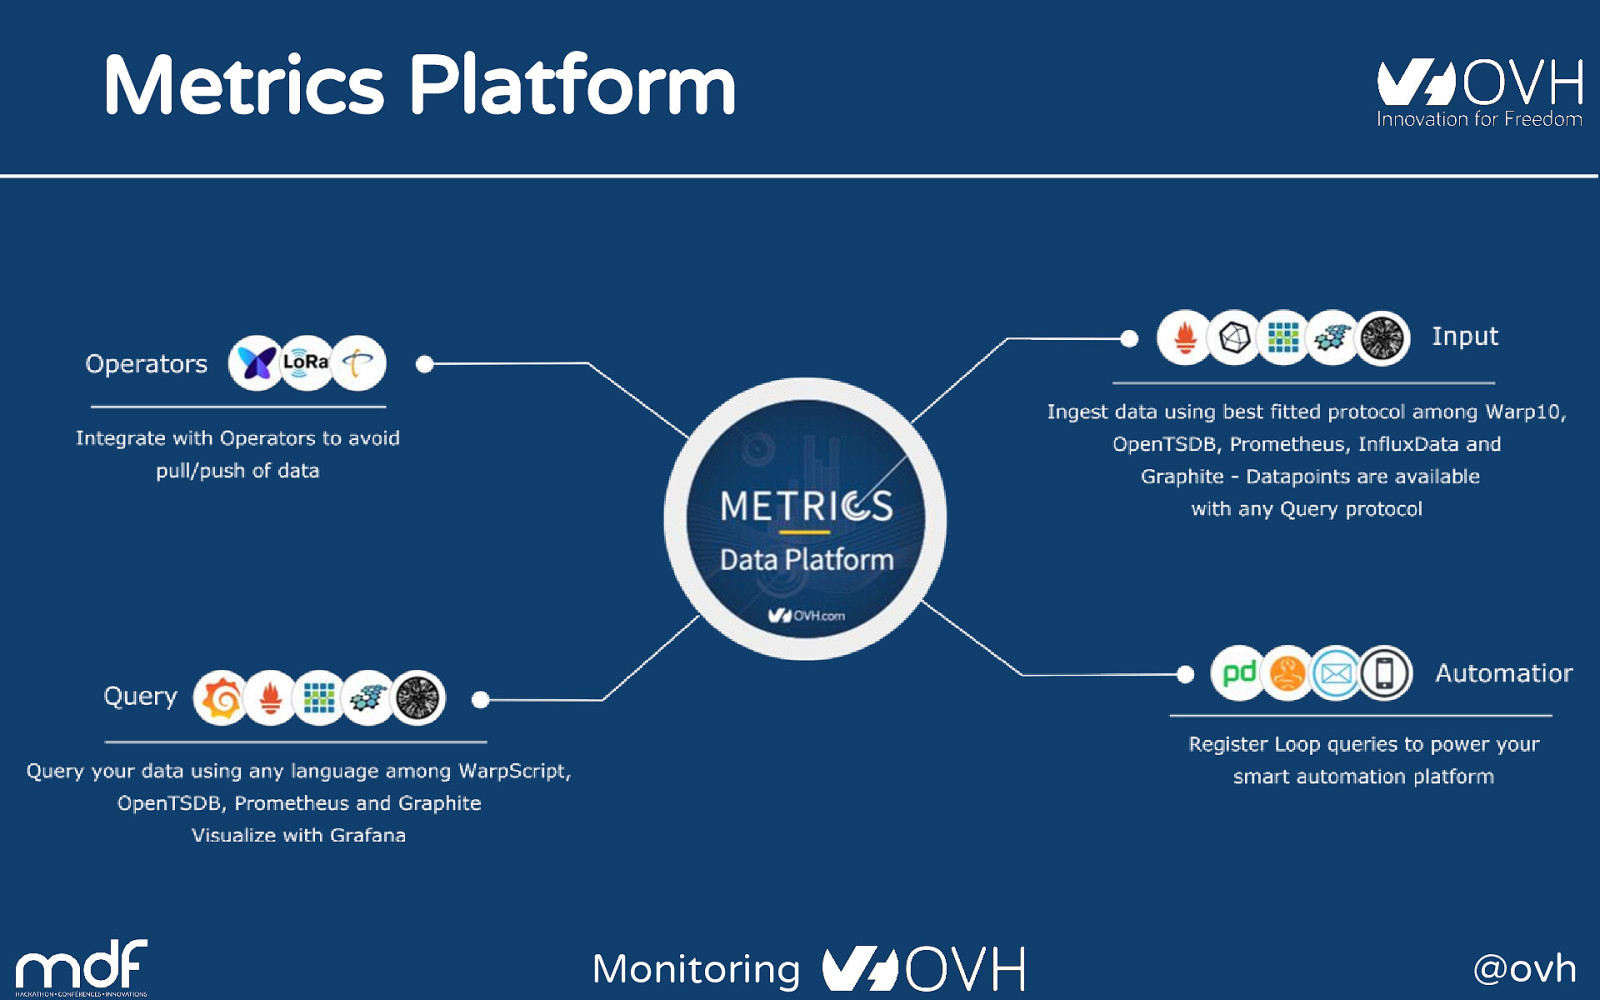
Metrics Data Platform + + Monitoring @ovh
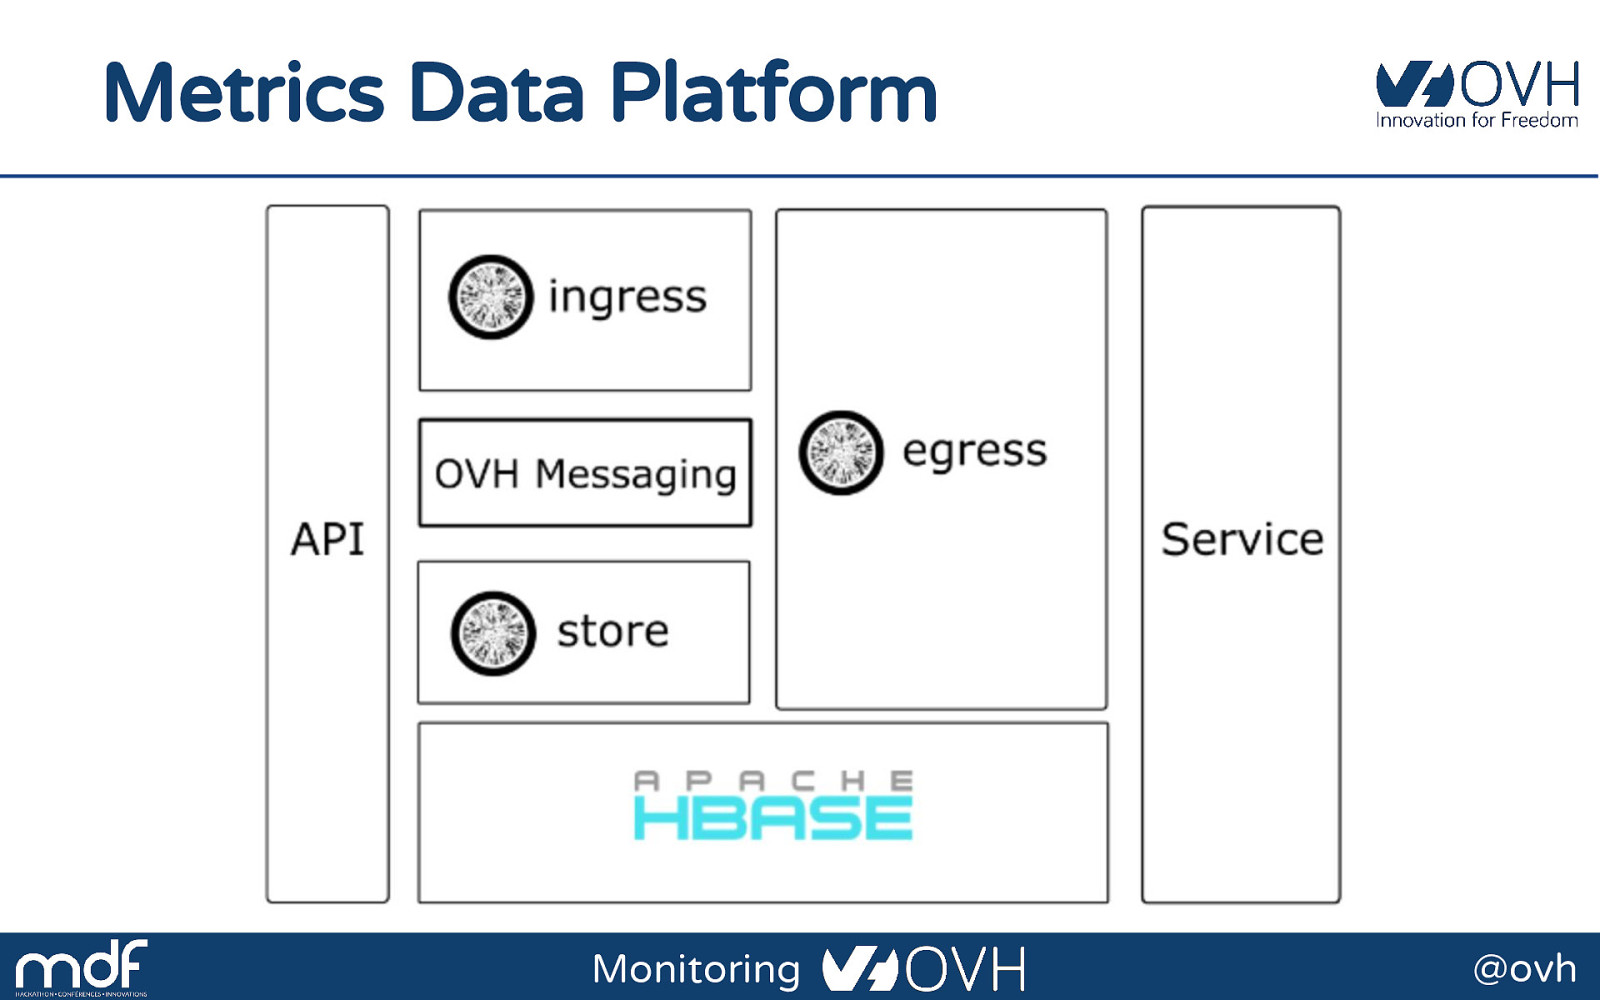
Metrics Data Platform Monitoring @ovh
Leverage an ecosystem and choose the right one... Monitoring @ovh
Multi-protocol Why to choose? We need them all! Monitoring @ovh
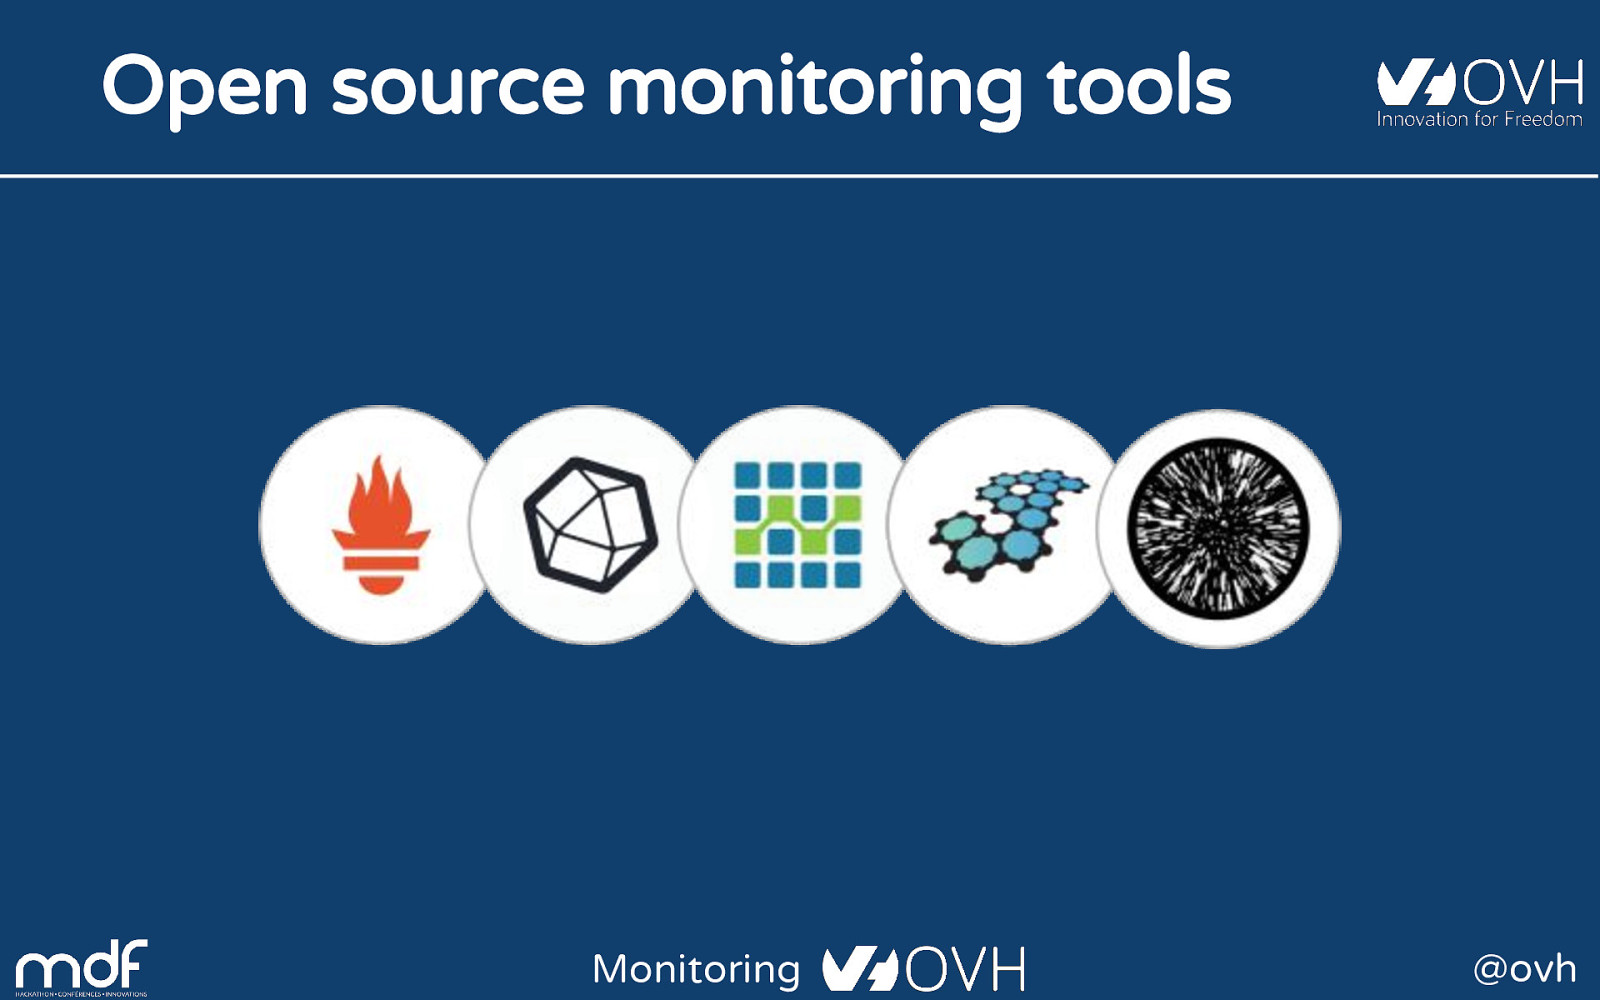
Open source monitoring tools Monitoring @ovh
Open source monitoring tools Monitoring @ovh
Open source monitoring tools Monitoring @ovh
Open source monitoring tools Monitoring @ovh
Open source monitoring tools Monitoring @ovh
Open source monitoring tools Monitoring @ovh
Open source monitoring tools Why choose? Let’s support all of them! Monitoring @ovh
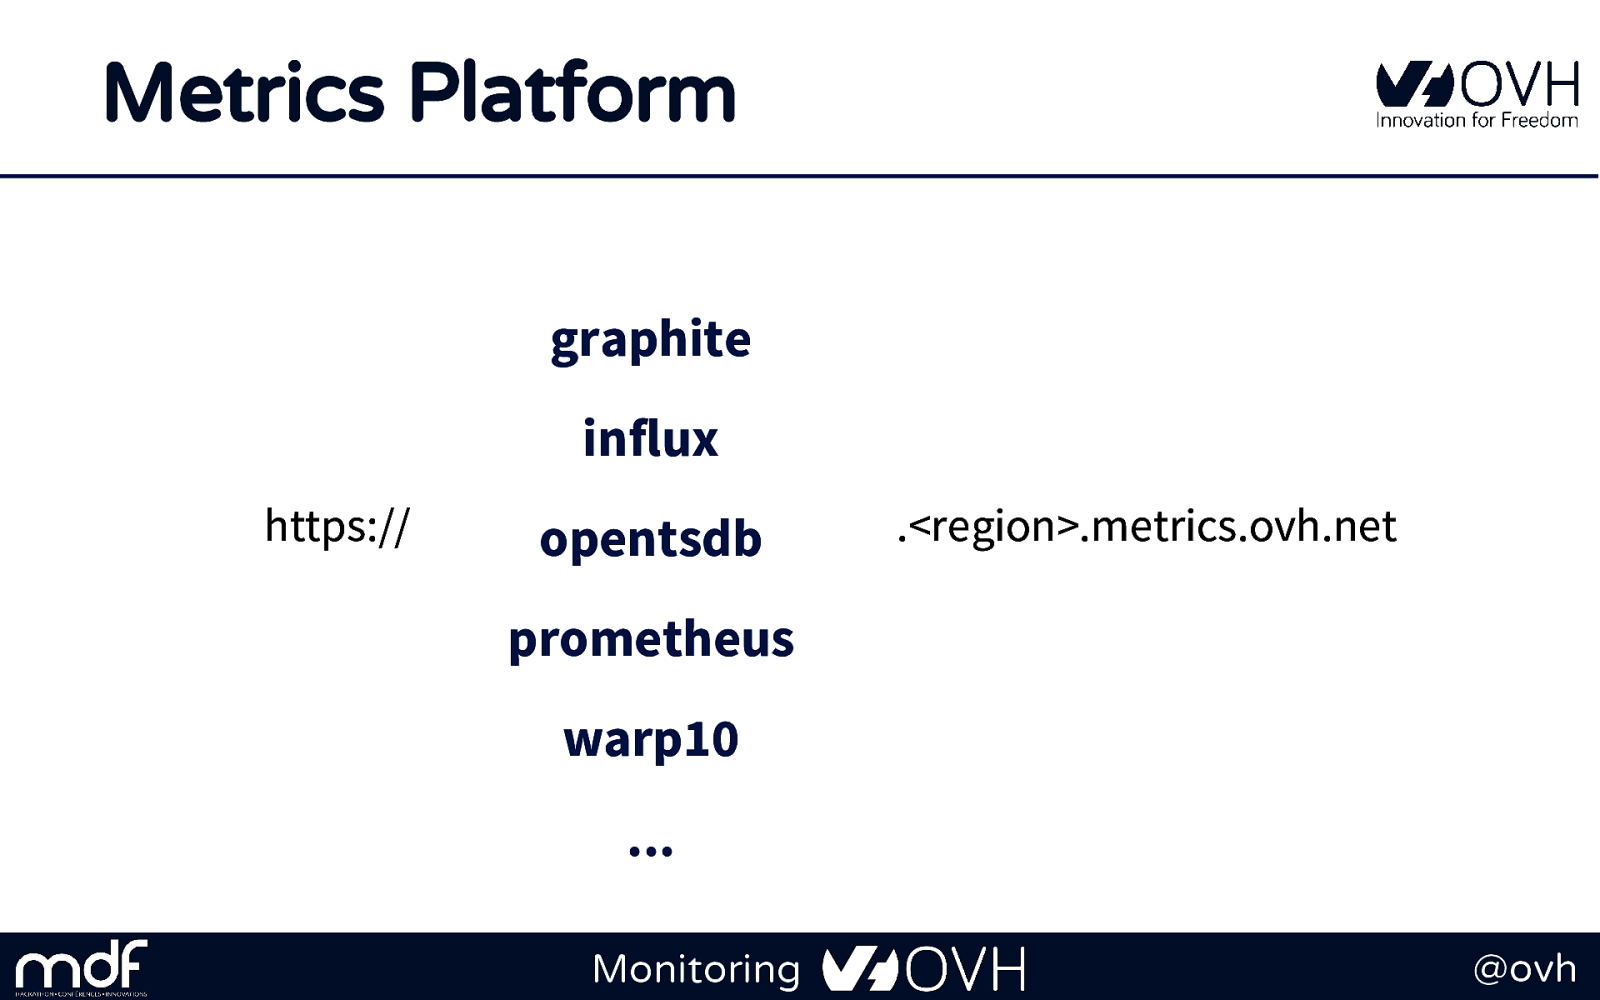
Metrics Platform Monitoring @ovh
Metrics Platform graphite influx https:// opentsdb .<region>.metrics.ovh.net prometheus warp10 ... Monitoring @ovh
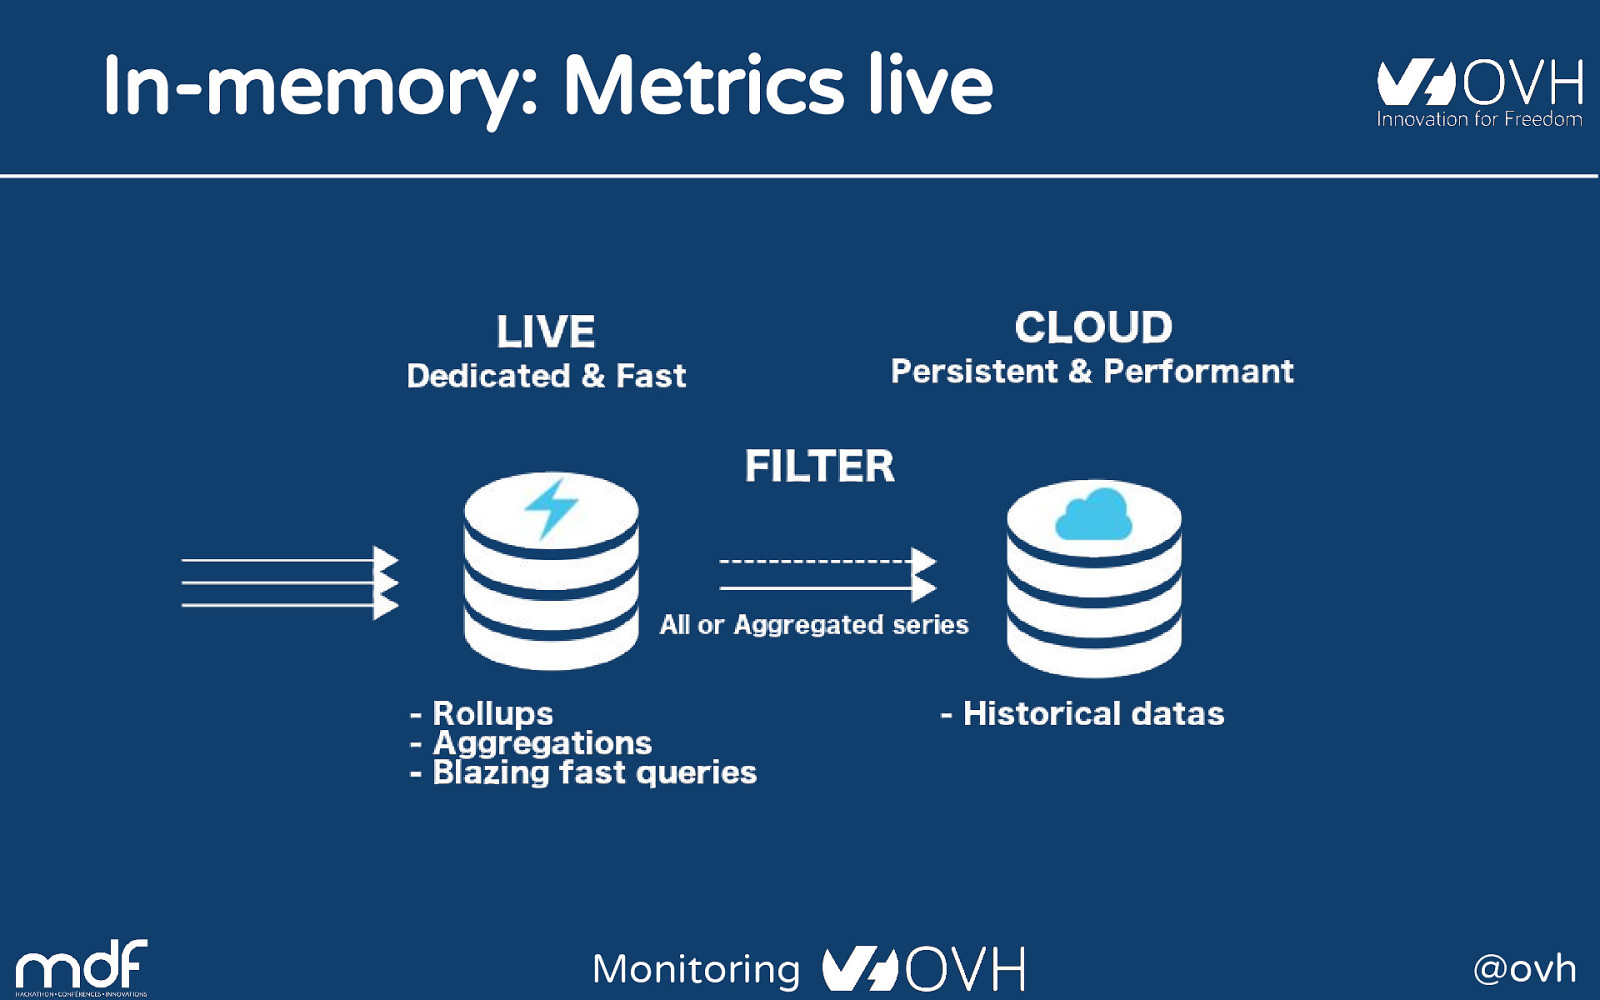
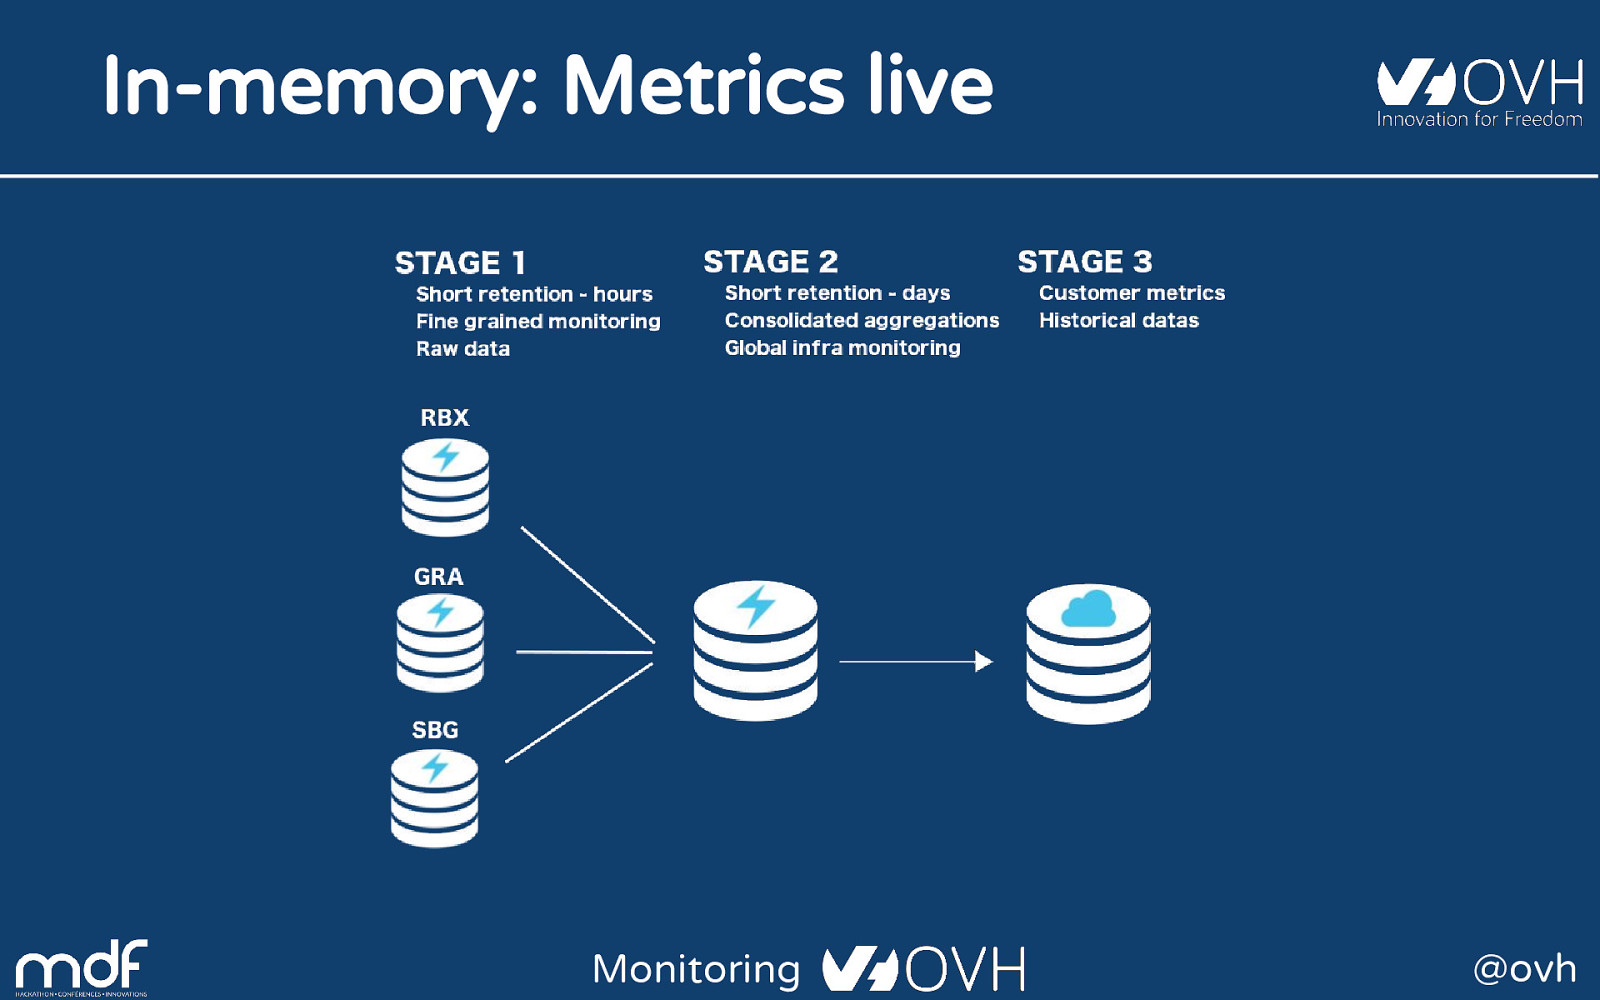
Metrics Live In-memory, high-performance Metrics instances Monitoring @ovh
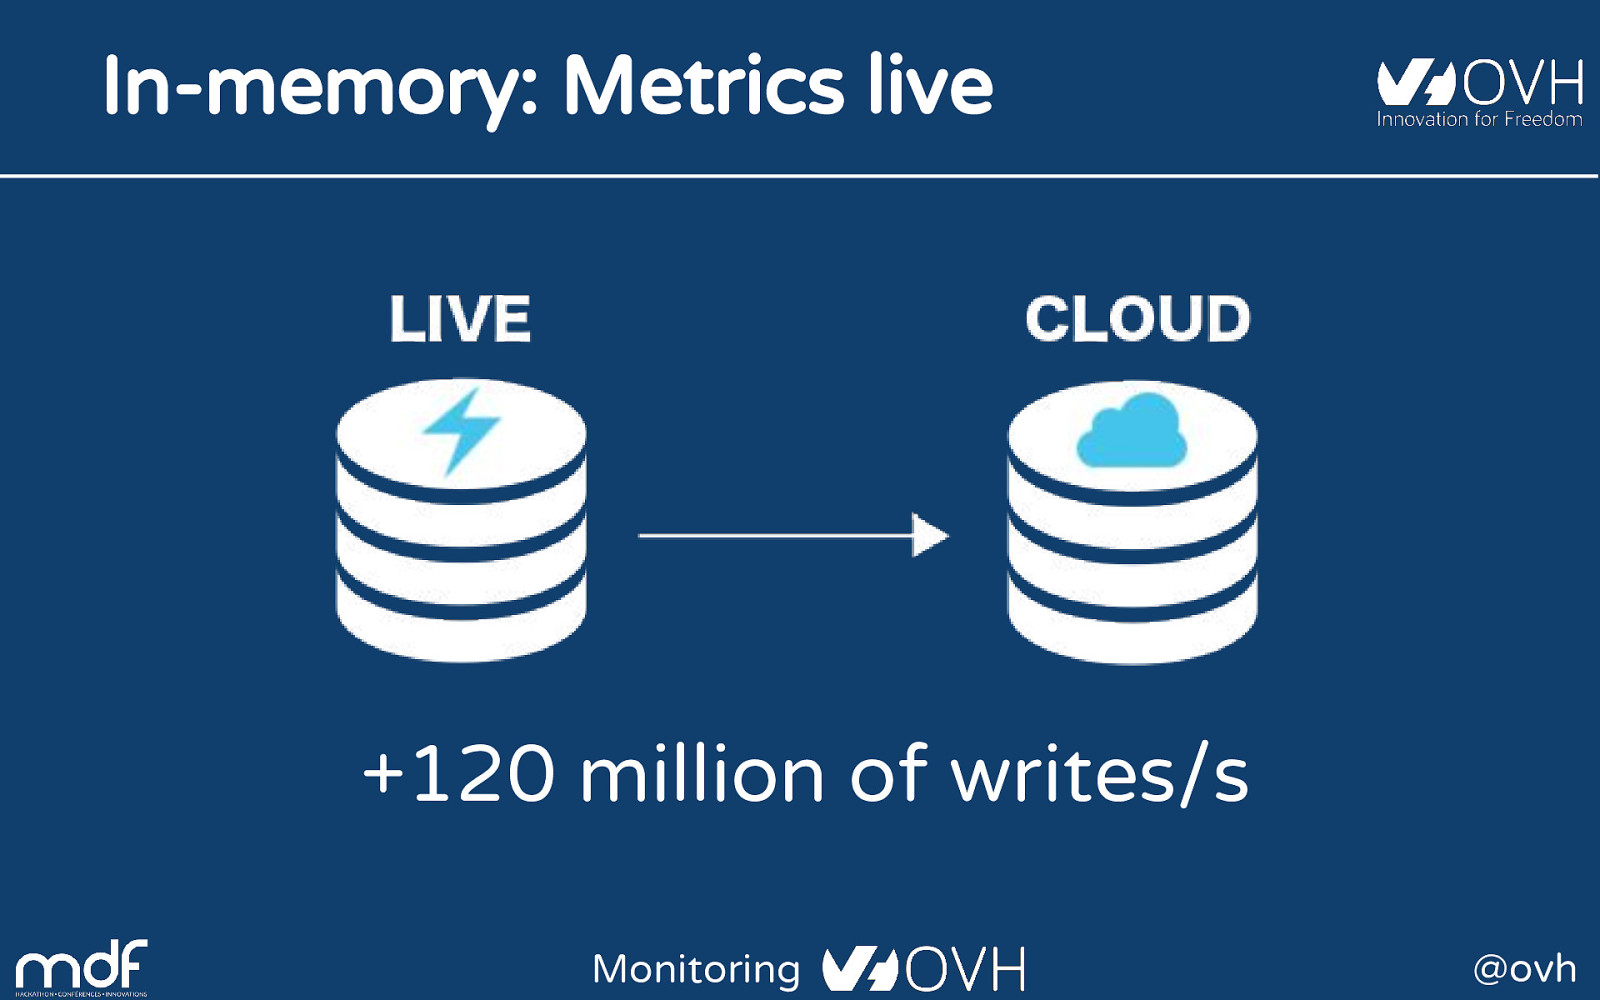
In-memory: Metrics live +120 million of writes/s Monitoring @ovh
In-memory: Metrics live Monitoring @ovh
In-memory: Metrics live Monitoring @ovh
Monitoring is only the beginning OVH Metrics answer to many other use cases Monitoring @ovh
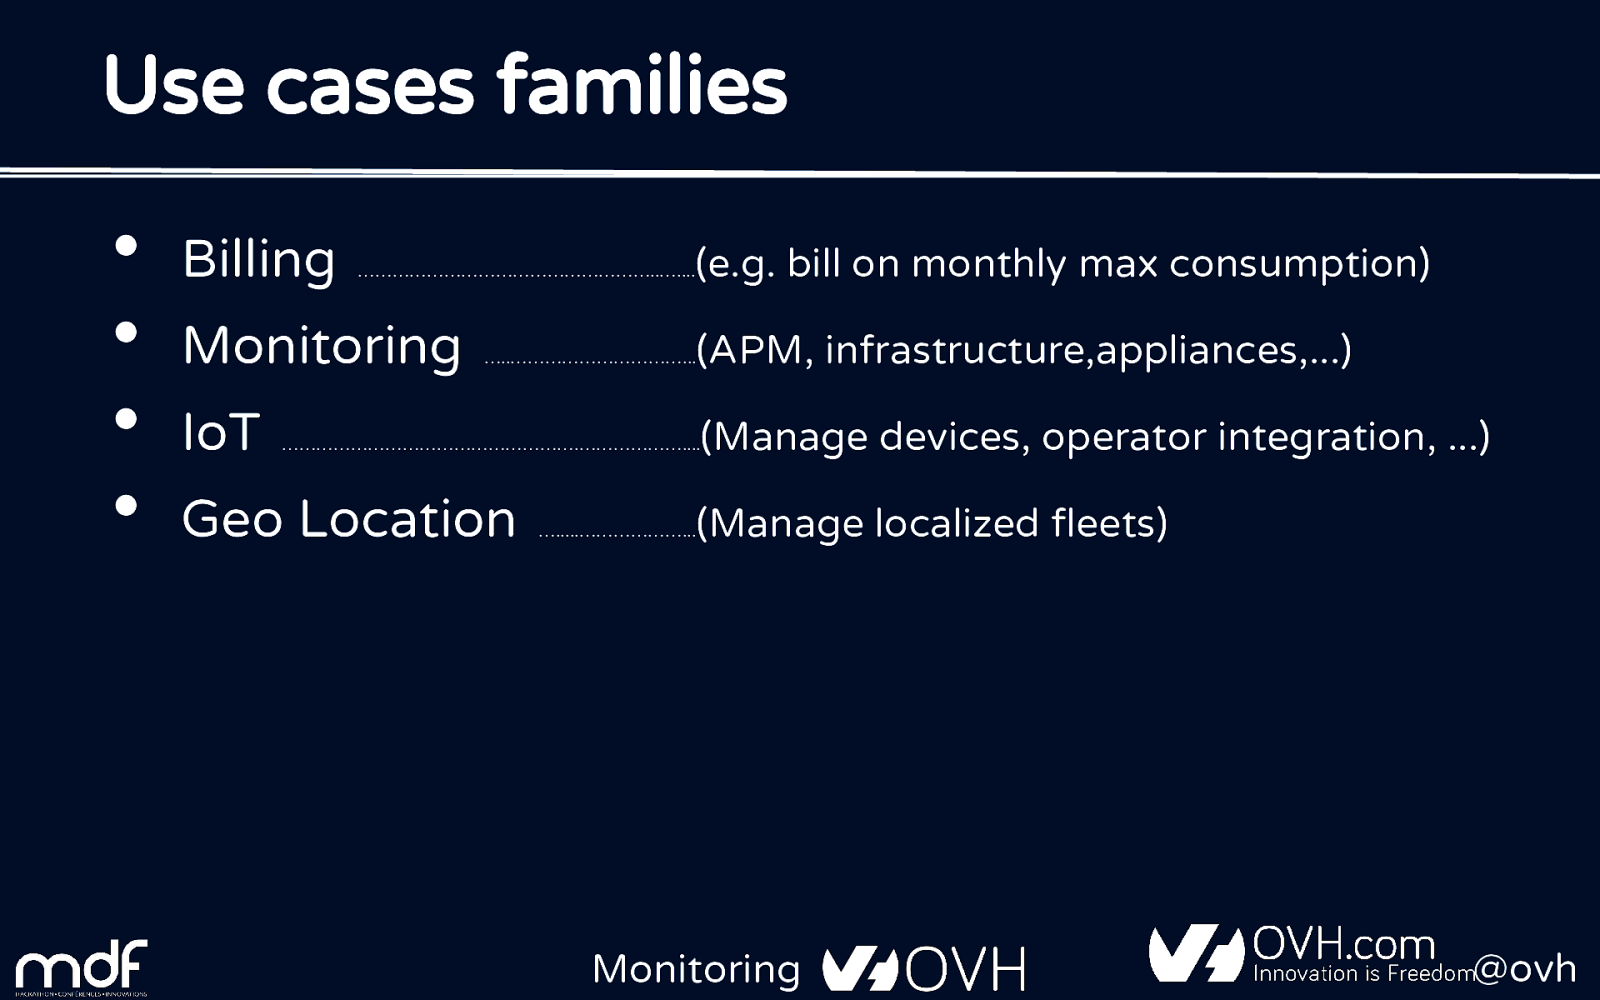
Use cases families • • • • Billing Monitoring IoT (e.g. bill on monthly max consumption) ……………………………………………..….... (APM, infrastructure,appliances,...) …..…………………………... (Manage devices, operator integration, ...) …………………………………………….……………….... Geo Location (Manage localized fleets) ….....………………... Monitoring @ovh
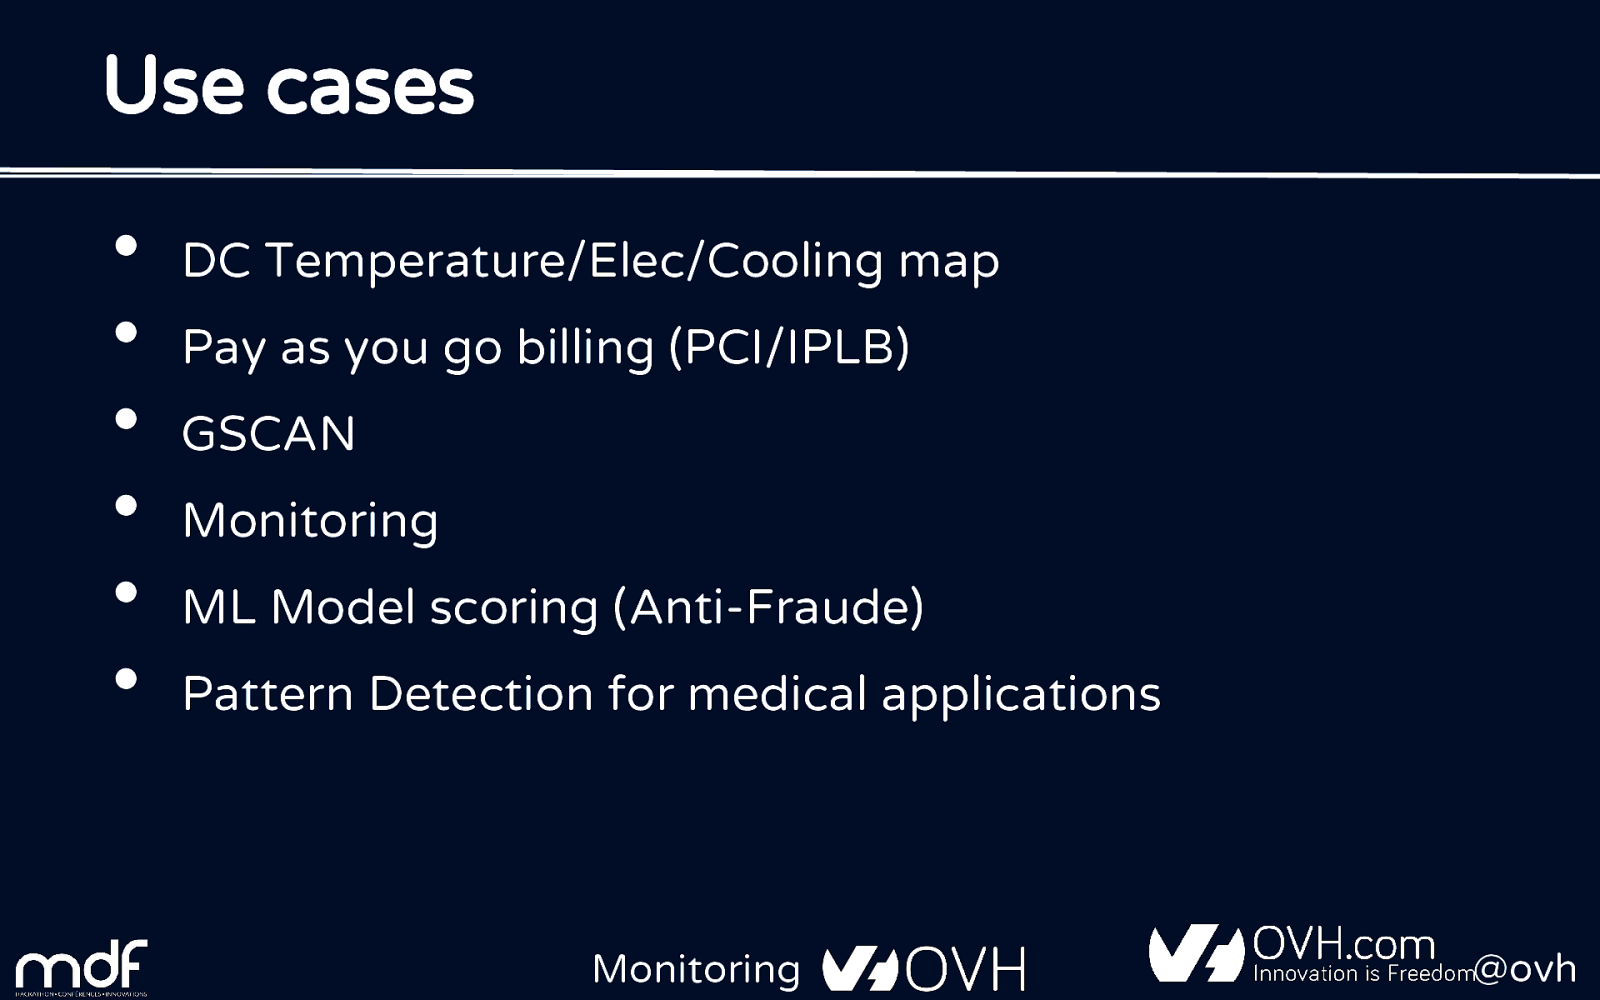
Use cases • • • • • • DC Temperature/Elec/Cooling map Pay as you go billing (PCI/IPLB) GSCAN Monitoring ML Model scoring (Anti-Fraude) Pattern Detection for medical applications Monitoring @ovh
Conclusion That's all folks! Monitoring @ovh
SREing Metrics With a great power comes great responsibility Monitoring @ovh
Metrics' own metrics 432 000 000 000 datapoints / day Monitoring @ovh
Metrics' own metrics 10 Tb / day Monitoring @ovh
Metrics' own metrics 5 000 000 dp/s Monitoring @ovh
Metrics' own metrics 500 000 000 series Monitoring @ovh
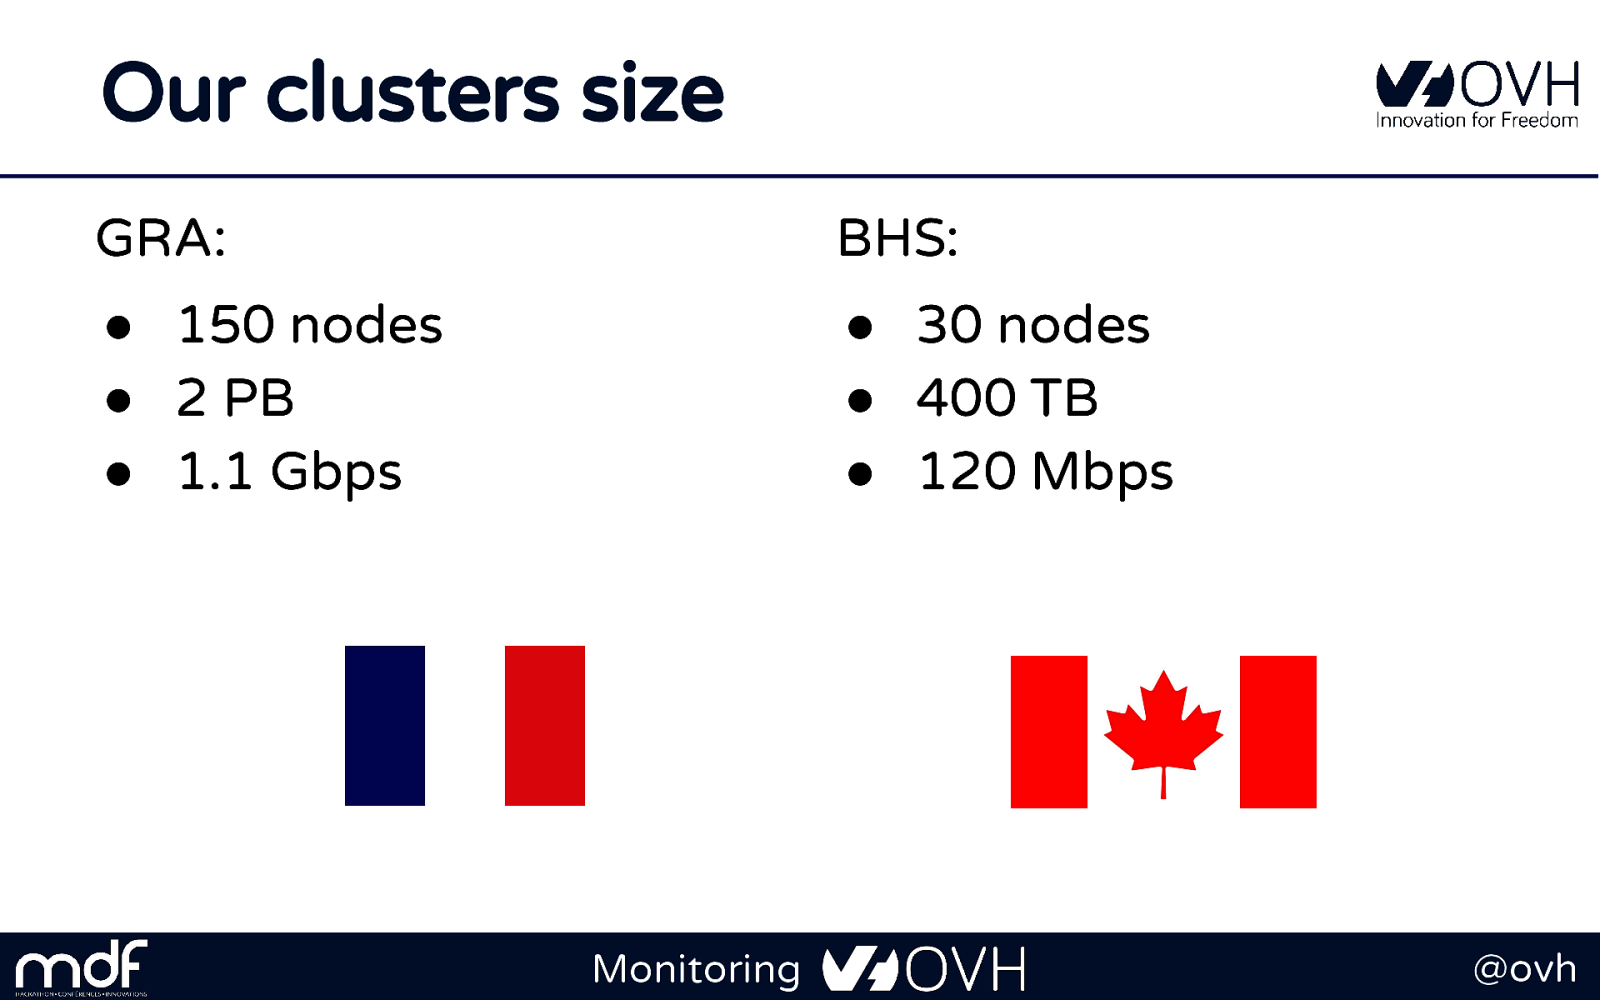
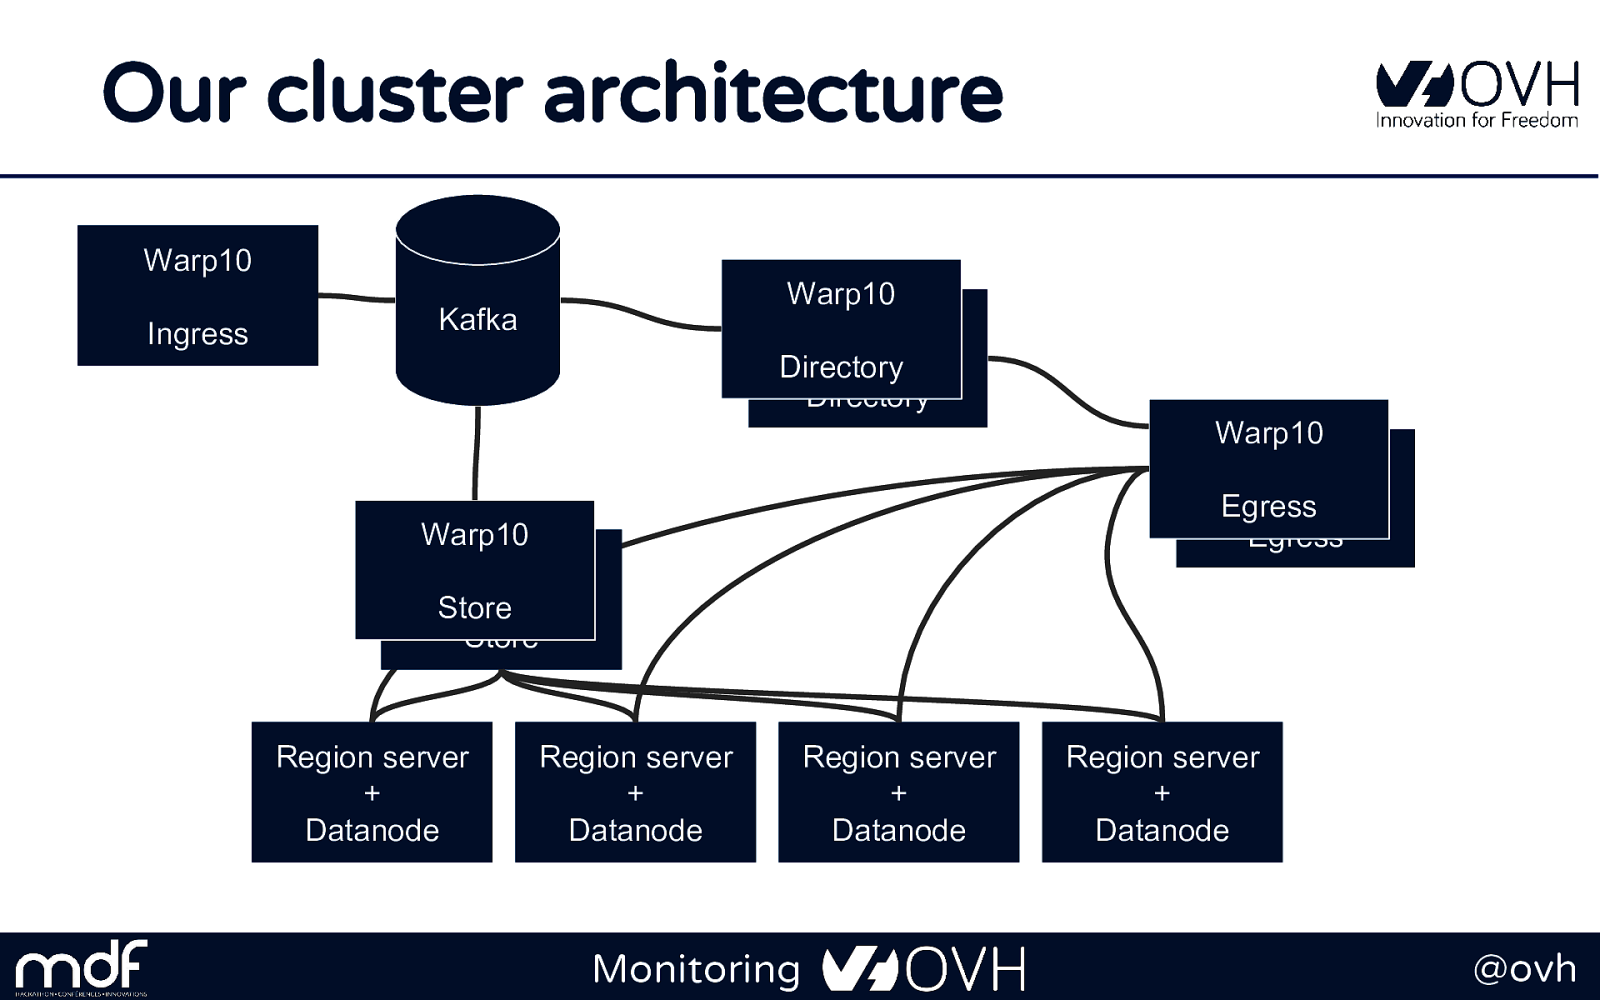
Our clusters size GRA: BHS: ● 150 nodes ● 2 PB ● 1.1 Gbps ● 30 nodes ● 400 TB ● 120 Mbps Monitoring @ovh
Our cluster architecture Warp10 Ingress Warp10 Warp10 Directory Directory Kafka Warp10 Warp10 Egress Egress Warp10 Warp10 Store Store Region server + Datanode Region server + Datanode Region server + Datanode Monitoring Region server + Datanode @ovh
Detecting errors Before it's too late Monitoring 89 @ovh
HBASE is designed to fail It’s really good at it Monitoring 90 @ovh
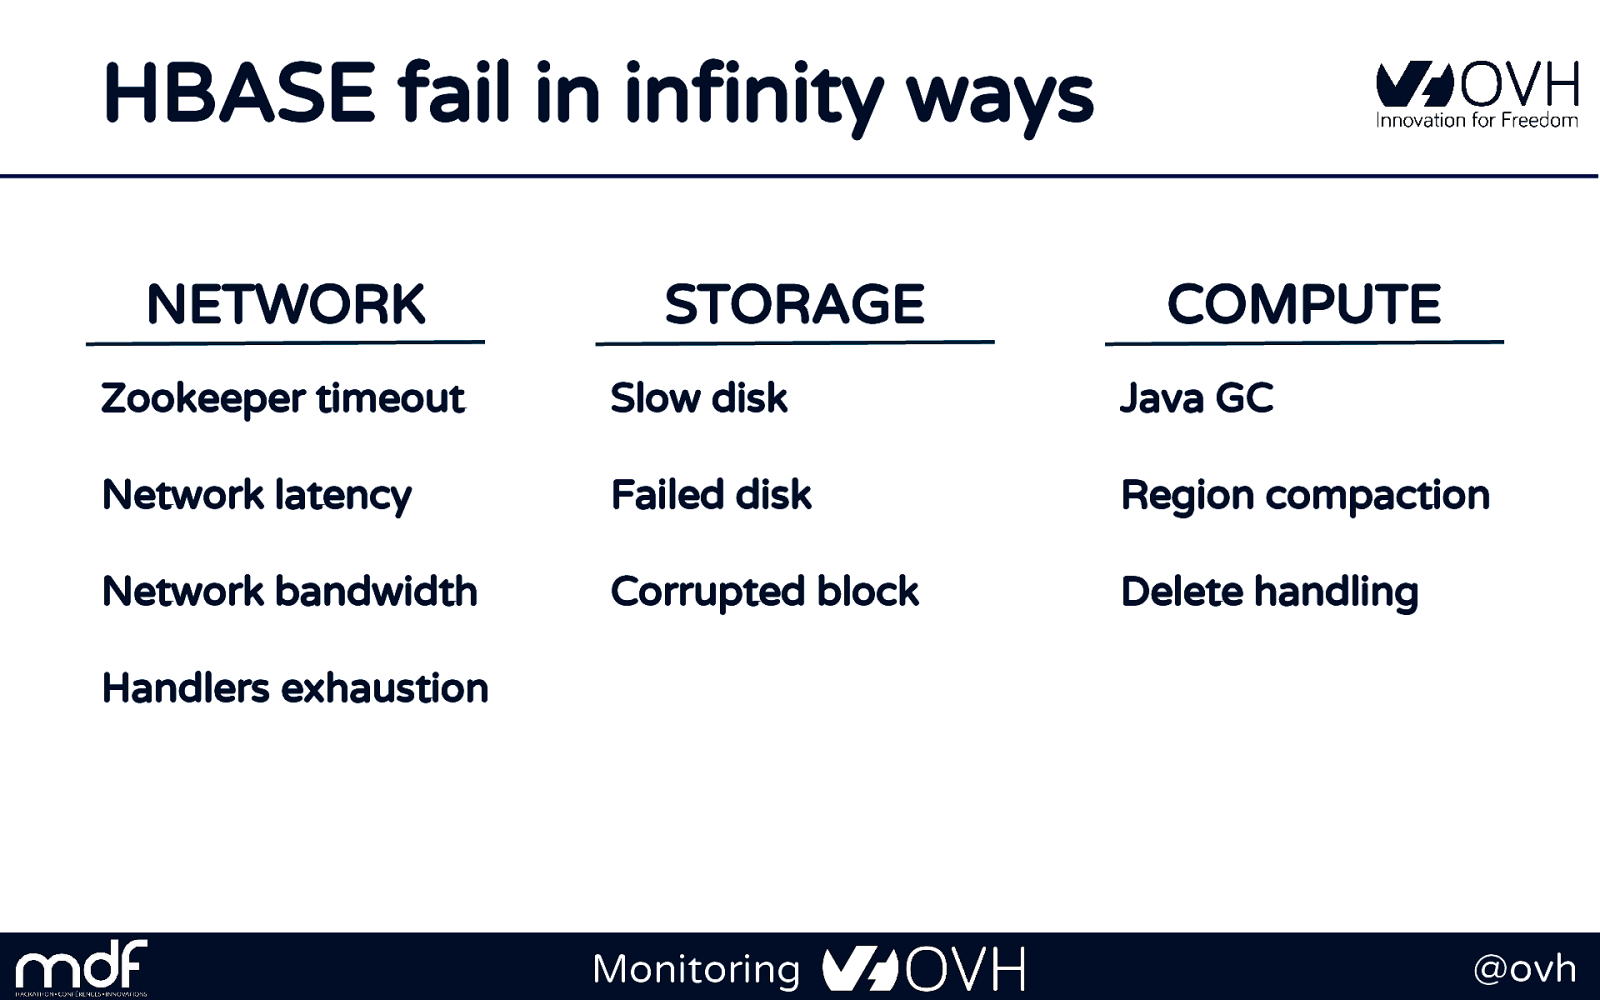
HBASE fail in infinity ways NETWORK STORAGE COMPUTE Zookeeper timeout Slow disk Java GC Network latency Failed disk Region compaction Network bandwidth Corrupted block Delete handling Handlers exhaustion Monitoring @ovh
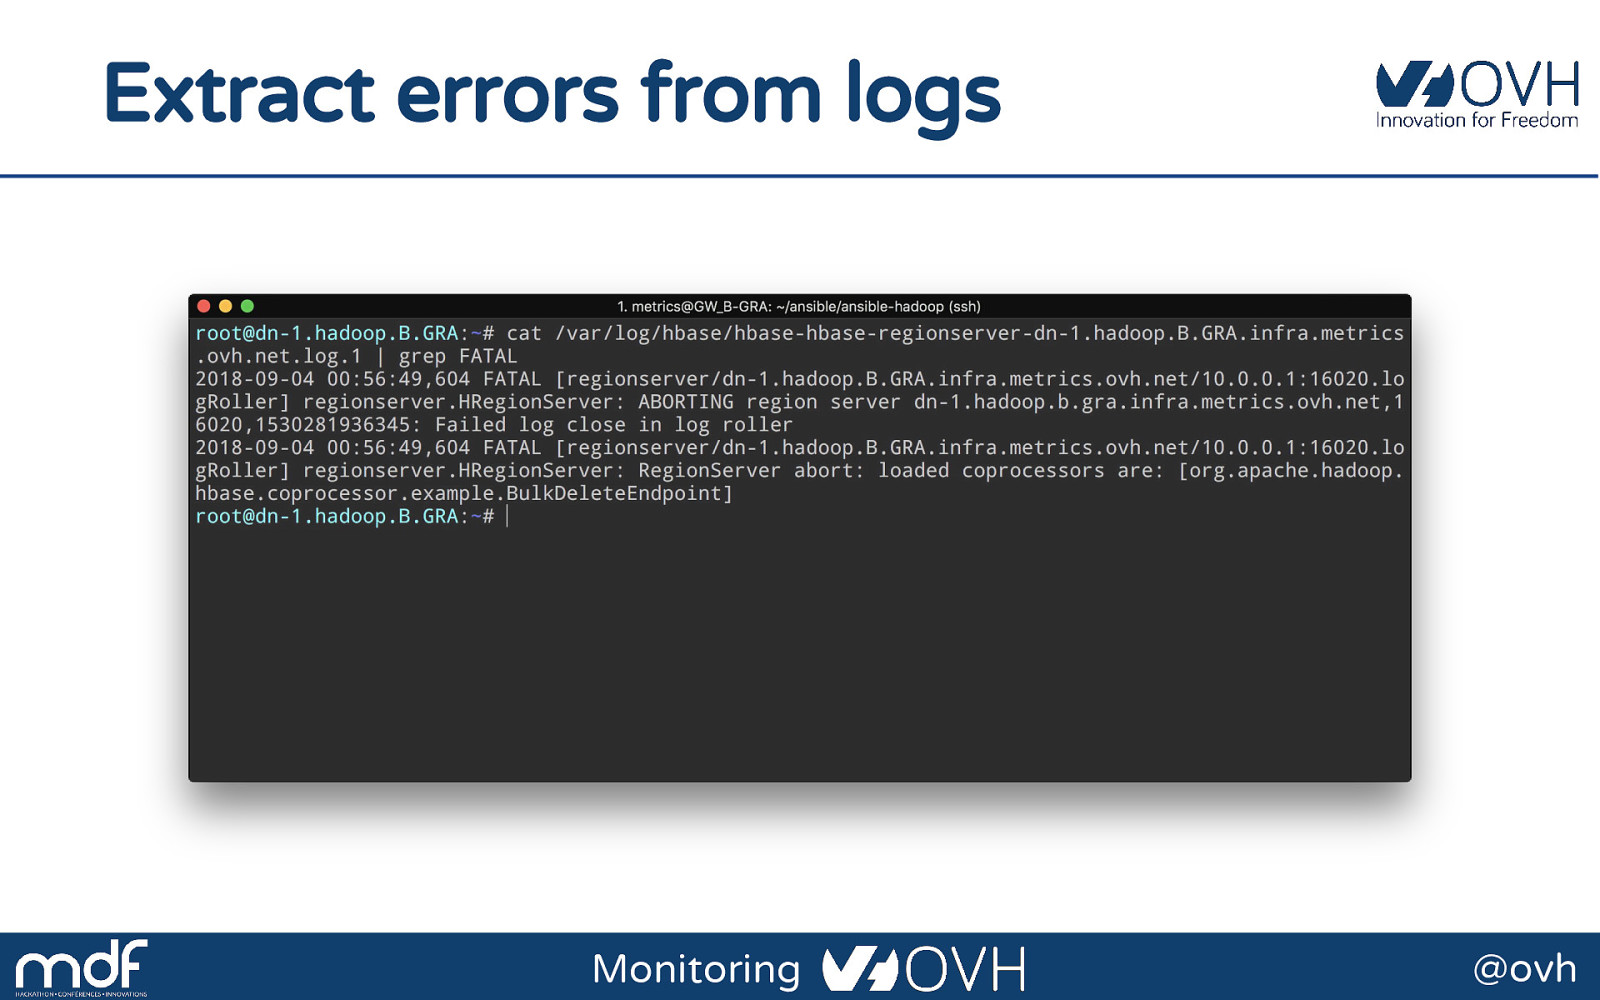
Extract errors from logs Monitoring @ovh
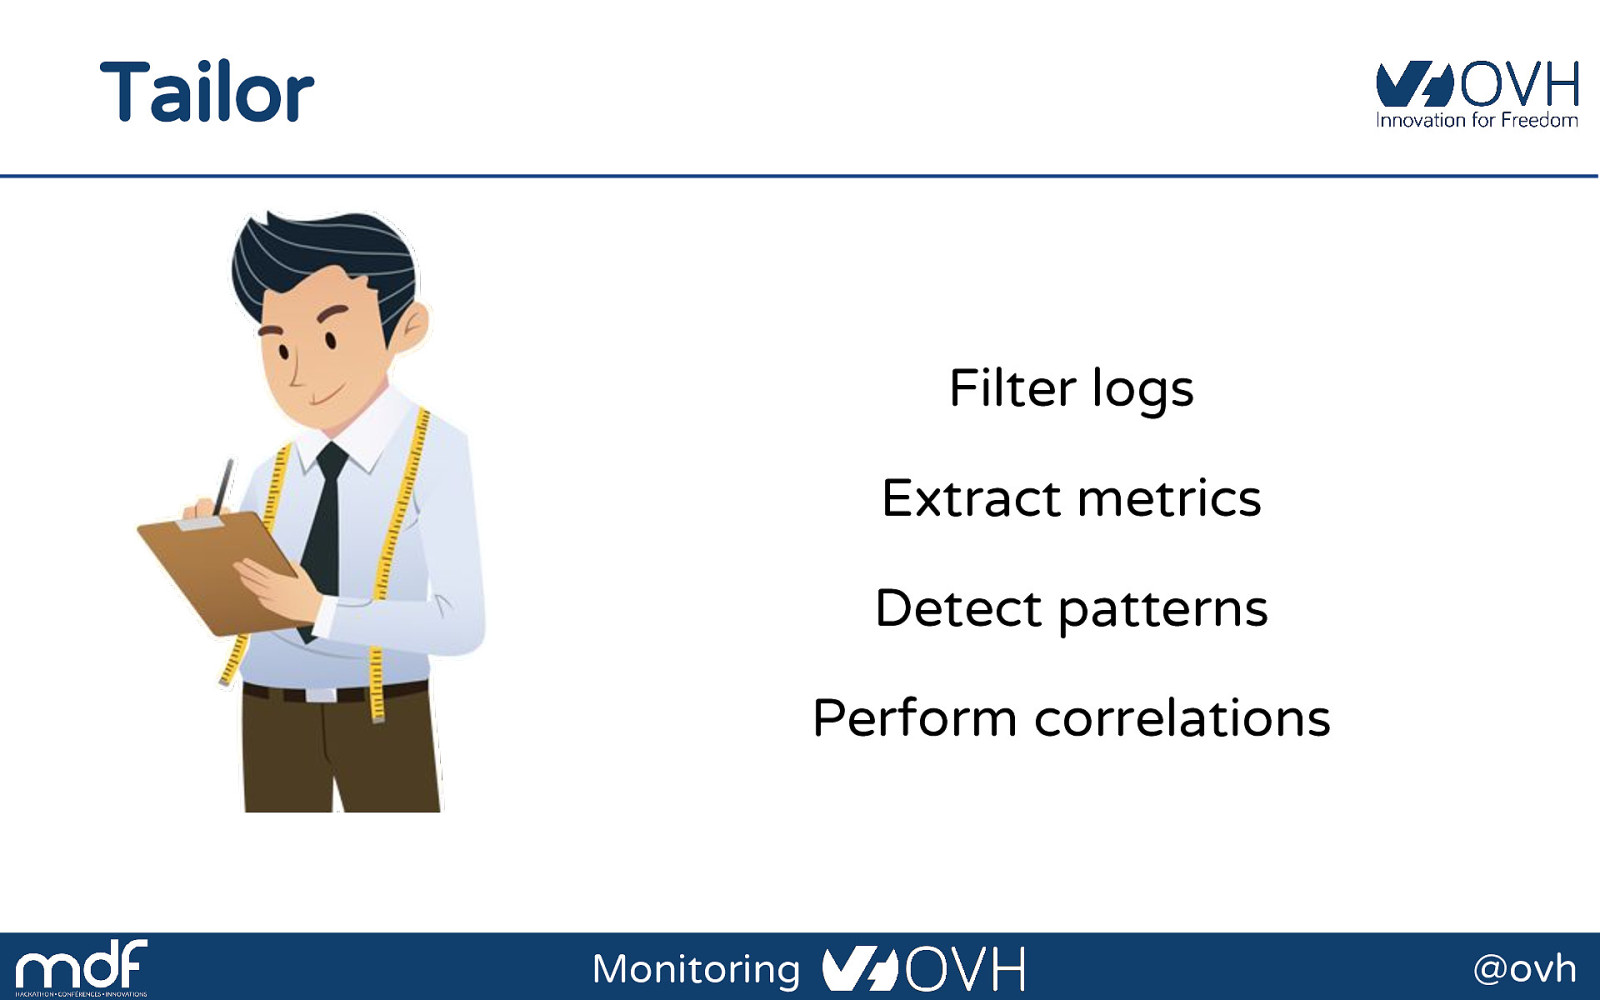
Tailor Filter logs Extract metrics Detect patterns Perform correlations Monitoring @ovh
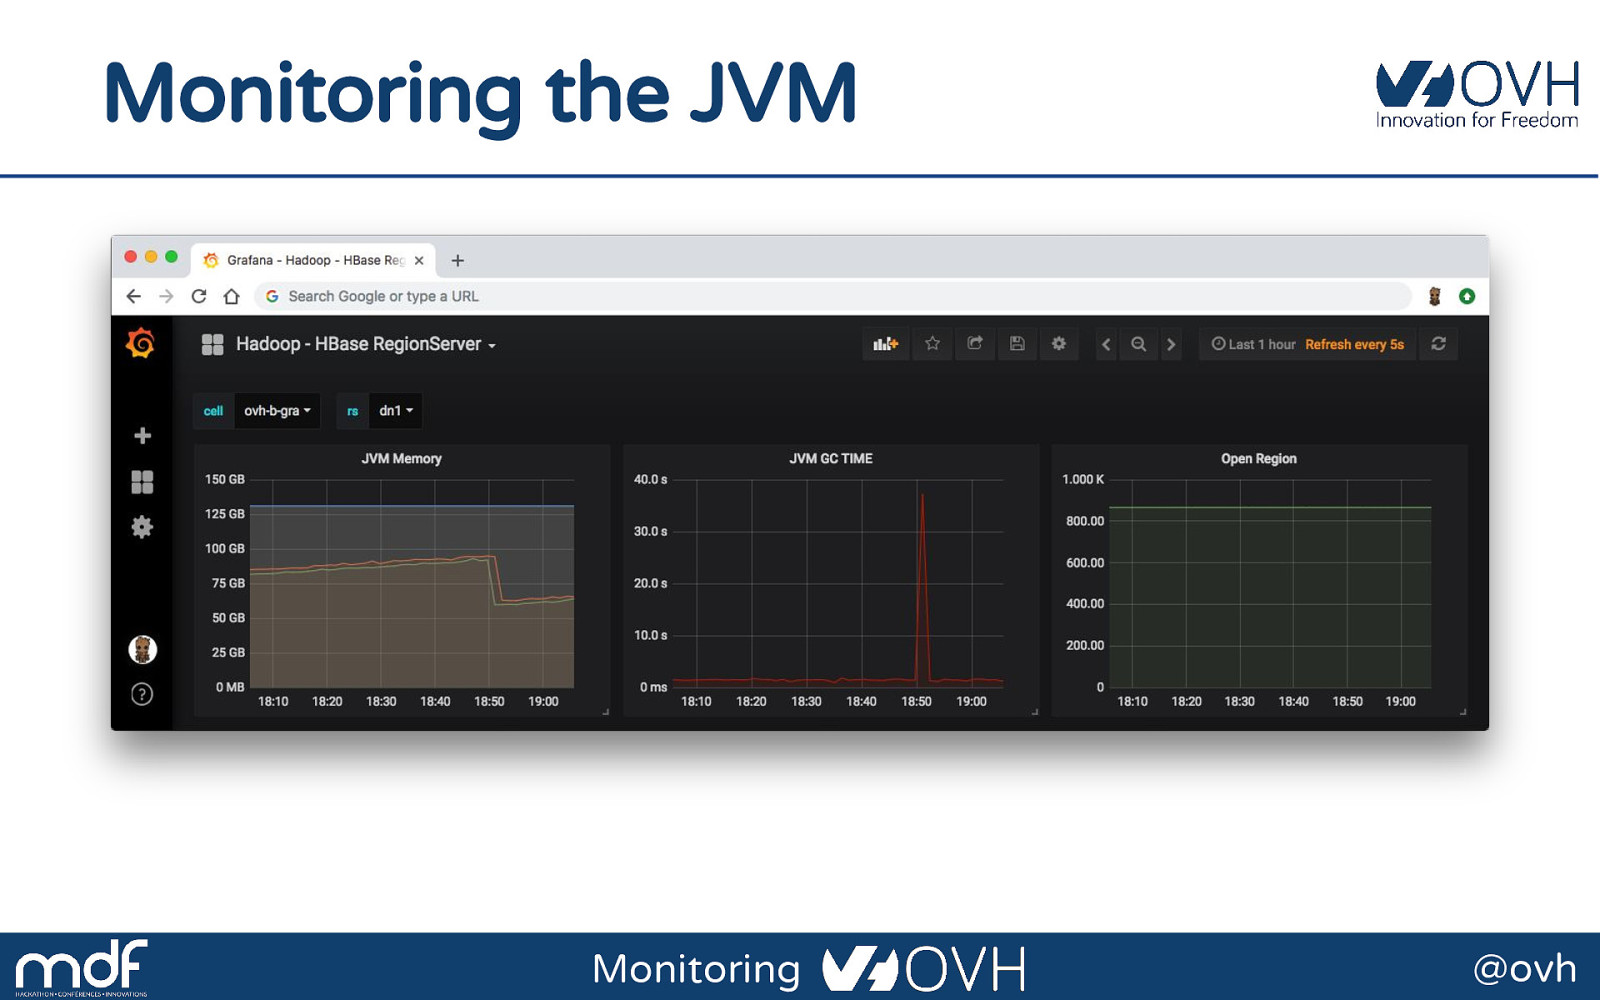
Monitoring the JVM Monitoring @ovh
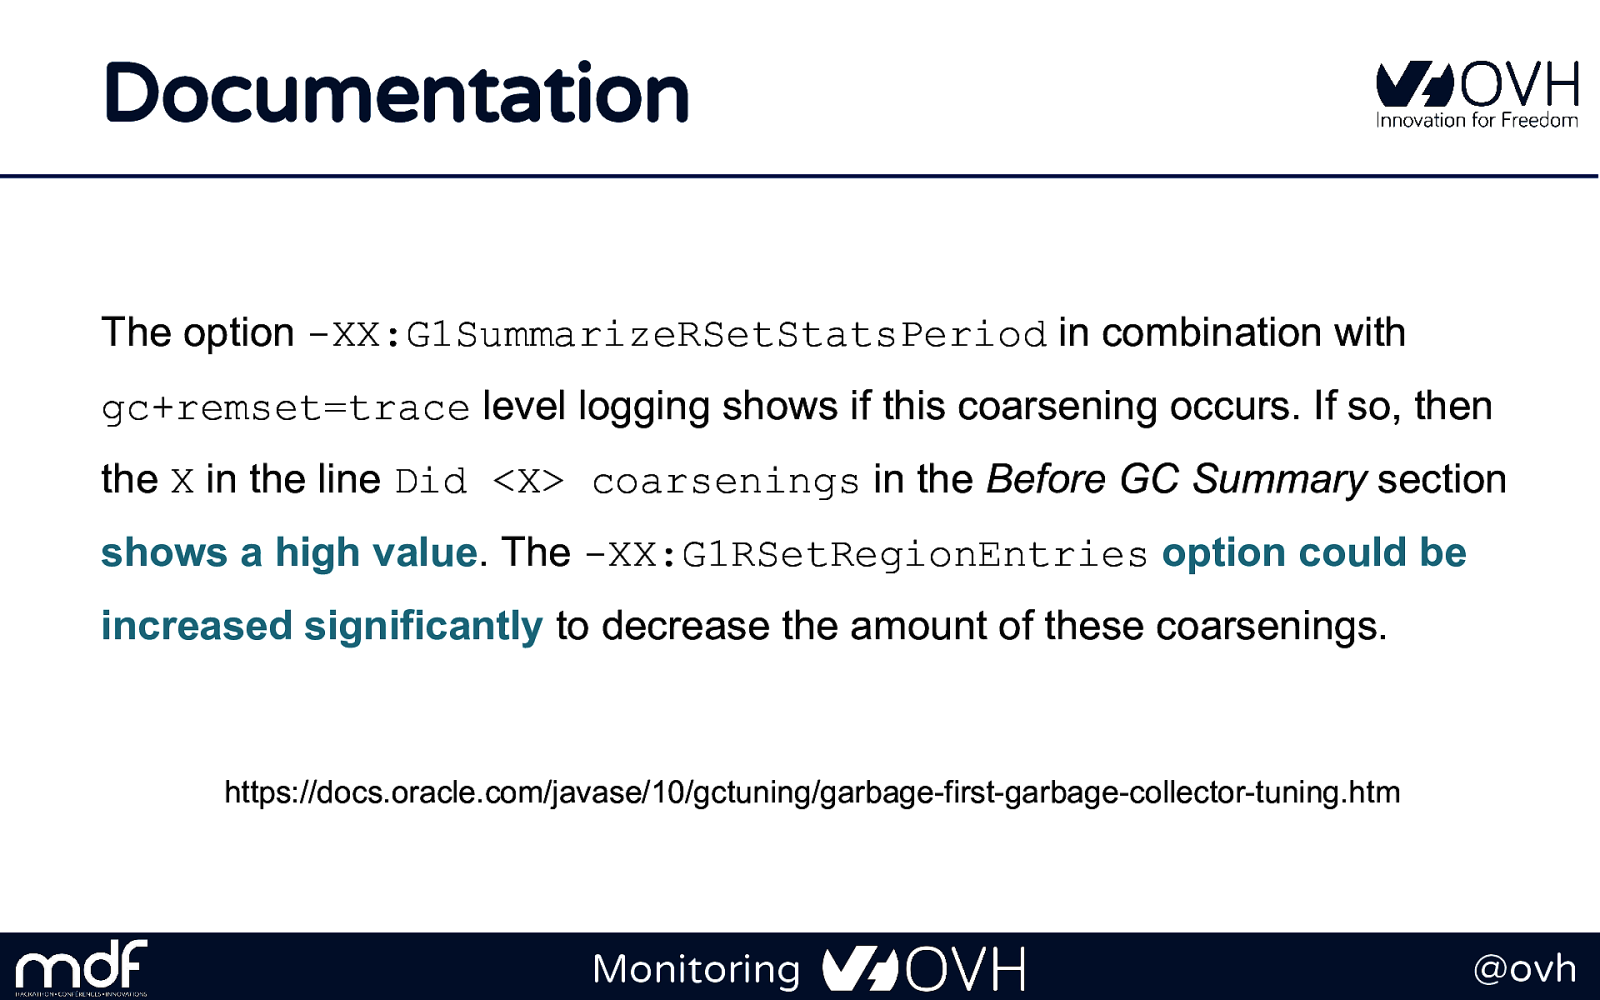
Documentation Monitoring @ovh
Documentation The option -XX:G1SummarizeRSetStatsPeriod in combination with gc+remset=trace level logging shows if this coarsening occurs. If so, then the X in the line Did <X> coarsenings in the Before GC Summary section shows a high value. The -XX:G1RSetRegionEntries option could be increased significantly to decrease the amount of these coarsenings. https://docs.oracle.com/javase/10/gctuning/garbage-first-garbage-collector-tuning.htm Monitoring @ovh
Let's observe what is happening Monitoring 97 @ovh
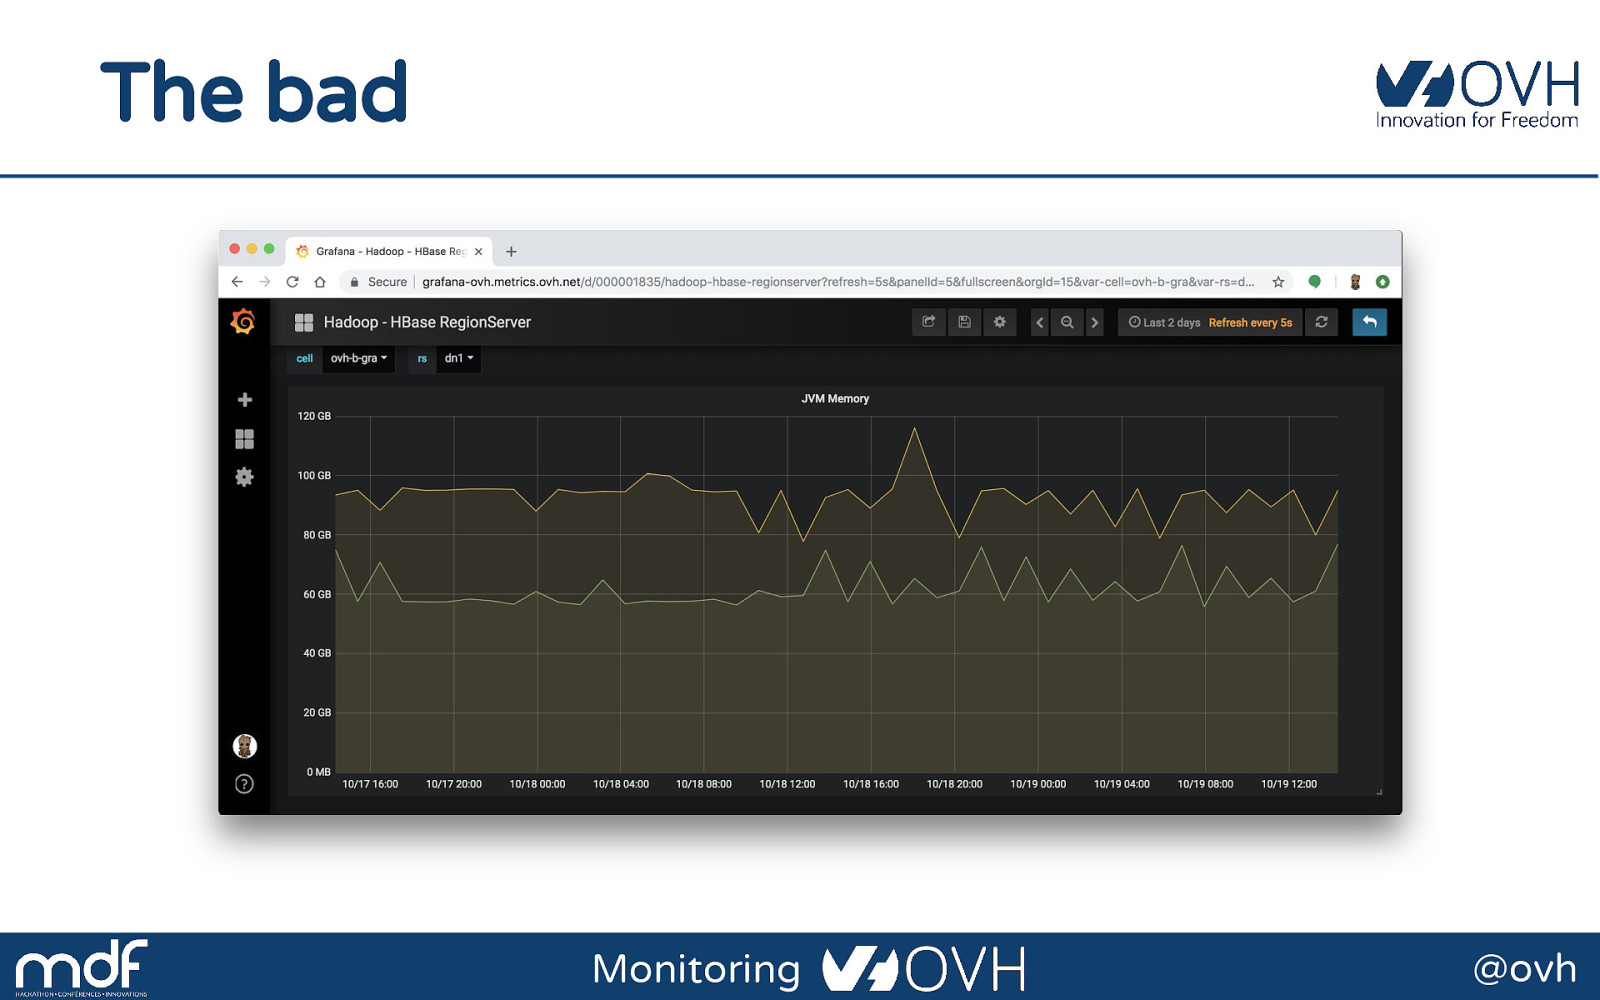
JVM GC The good, the bad and the ugly Monitoring @ovh
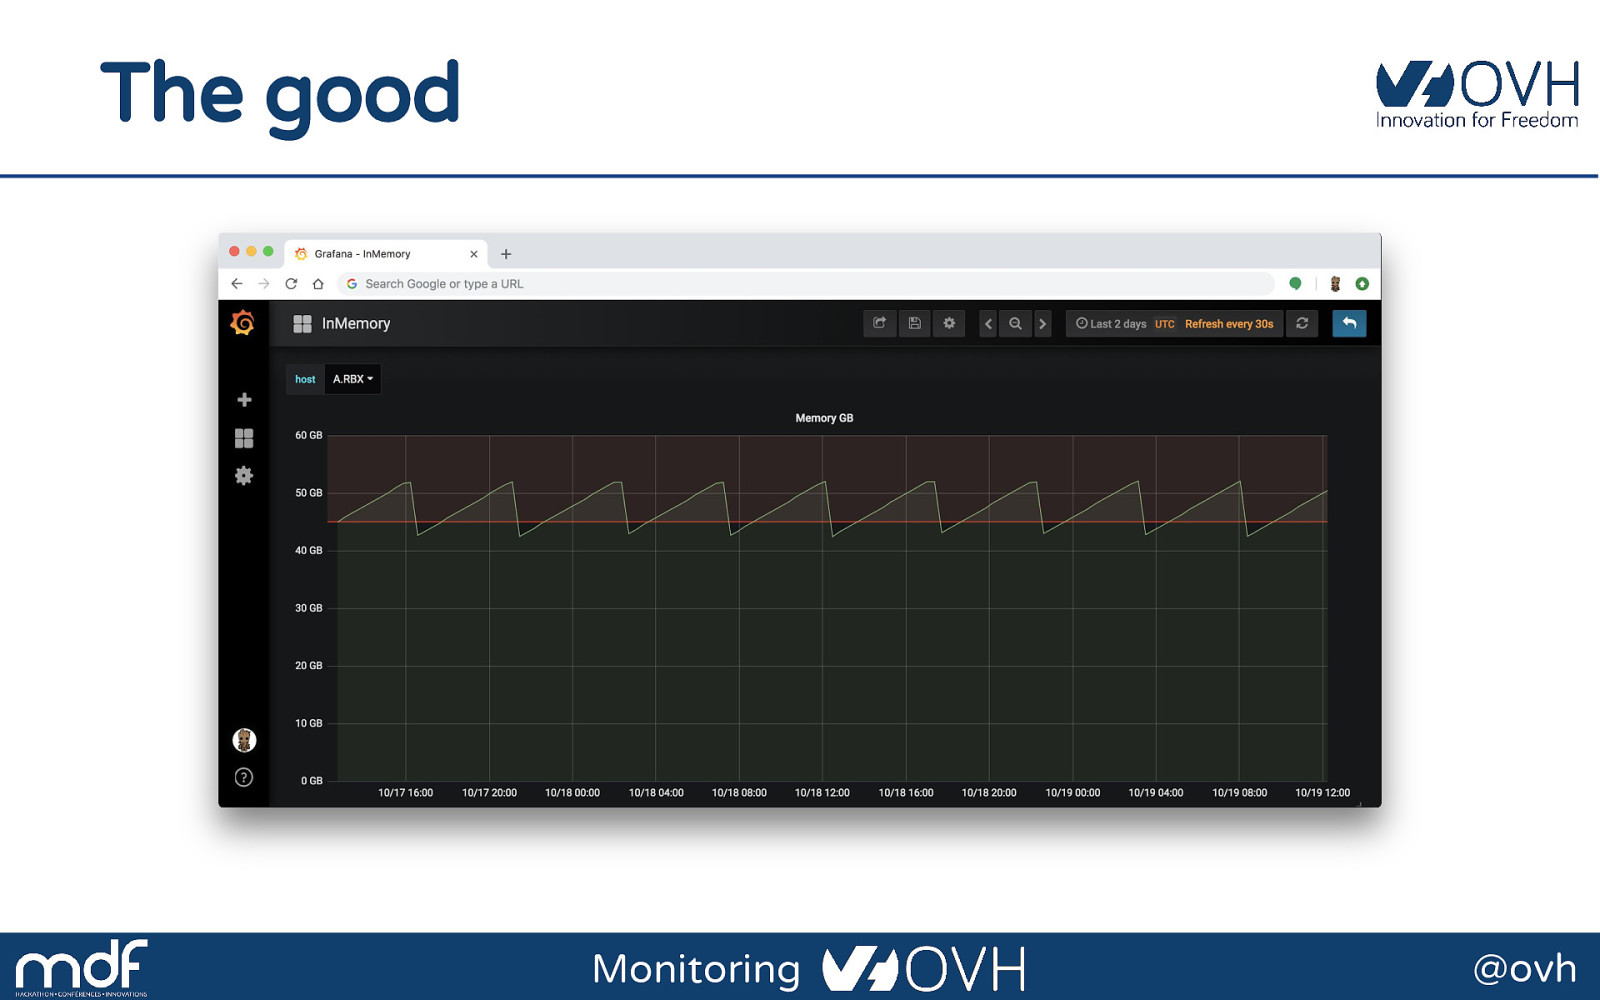
The good Monitoring @ovh
The bad Monitoring @ovh
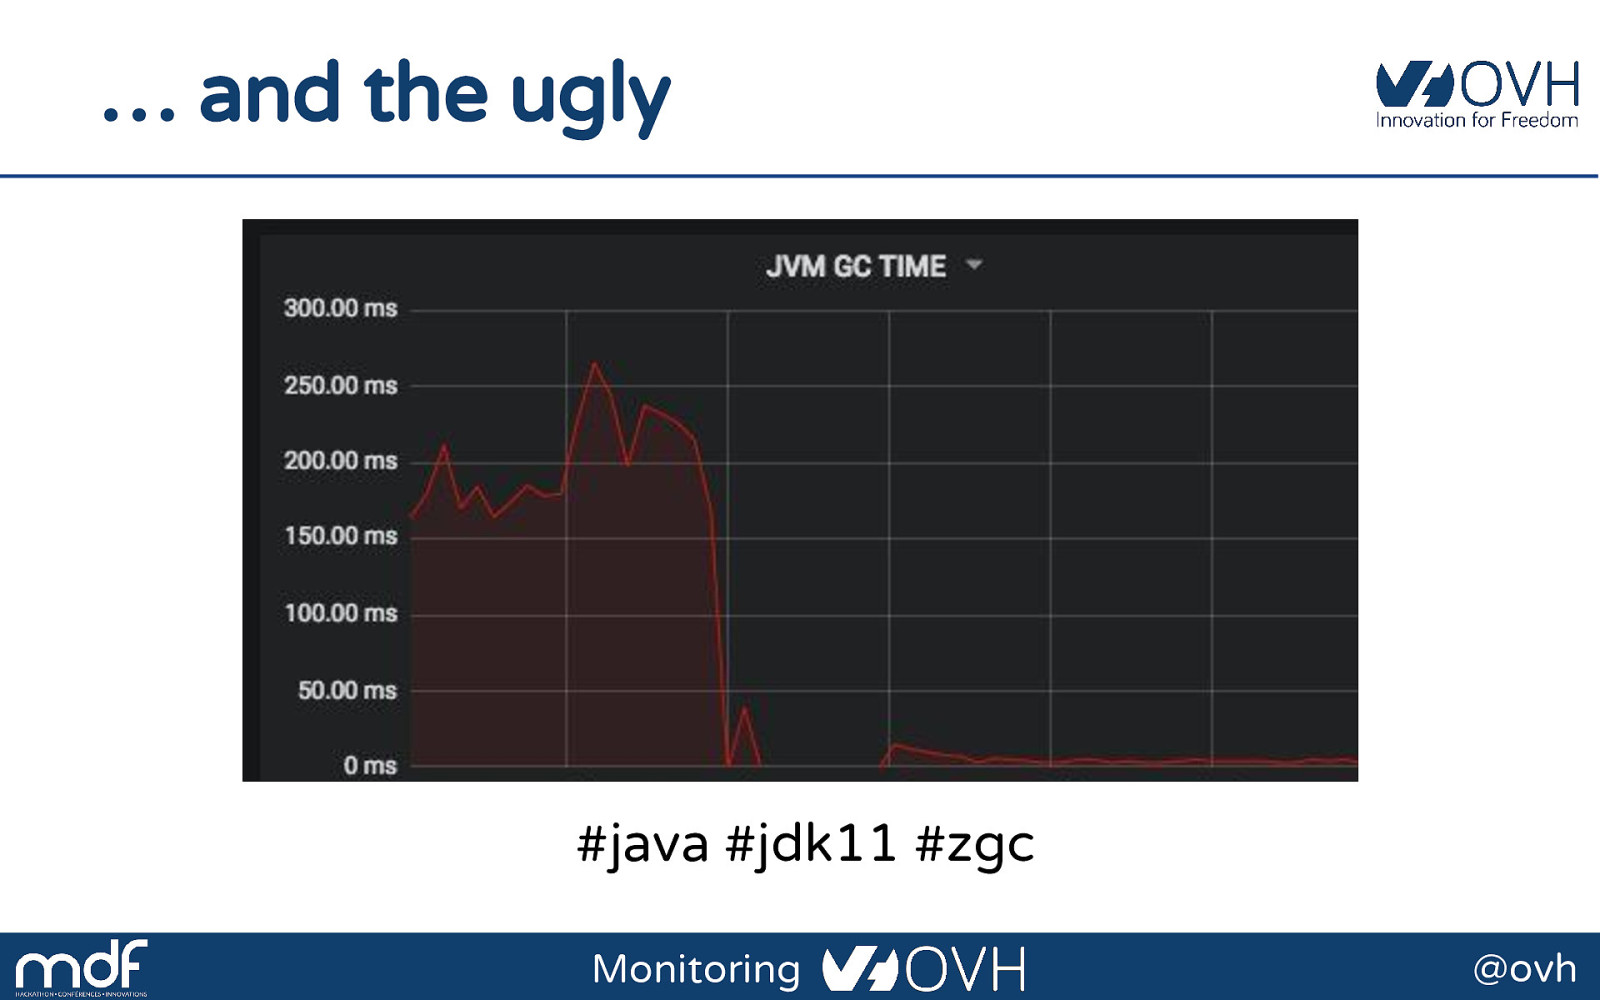
… and the ugly #java #jdk11 #zgc Monitoring @ovh
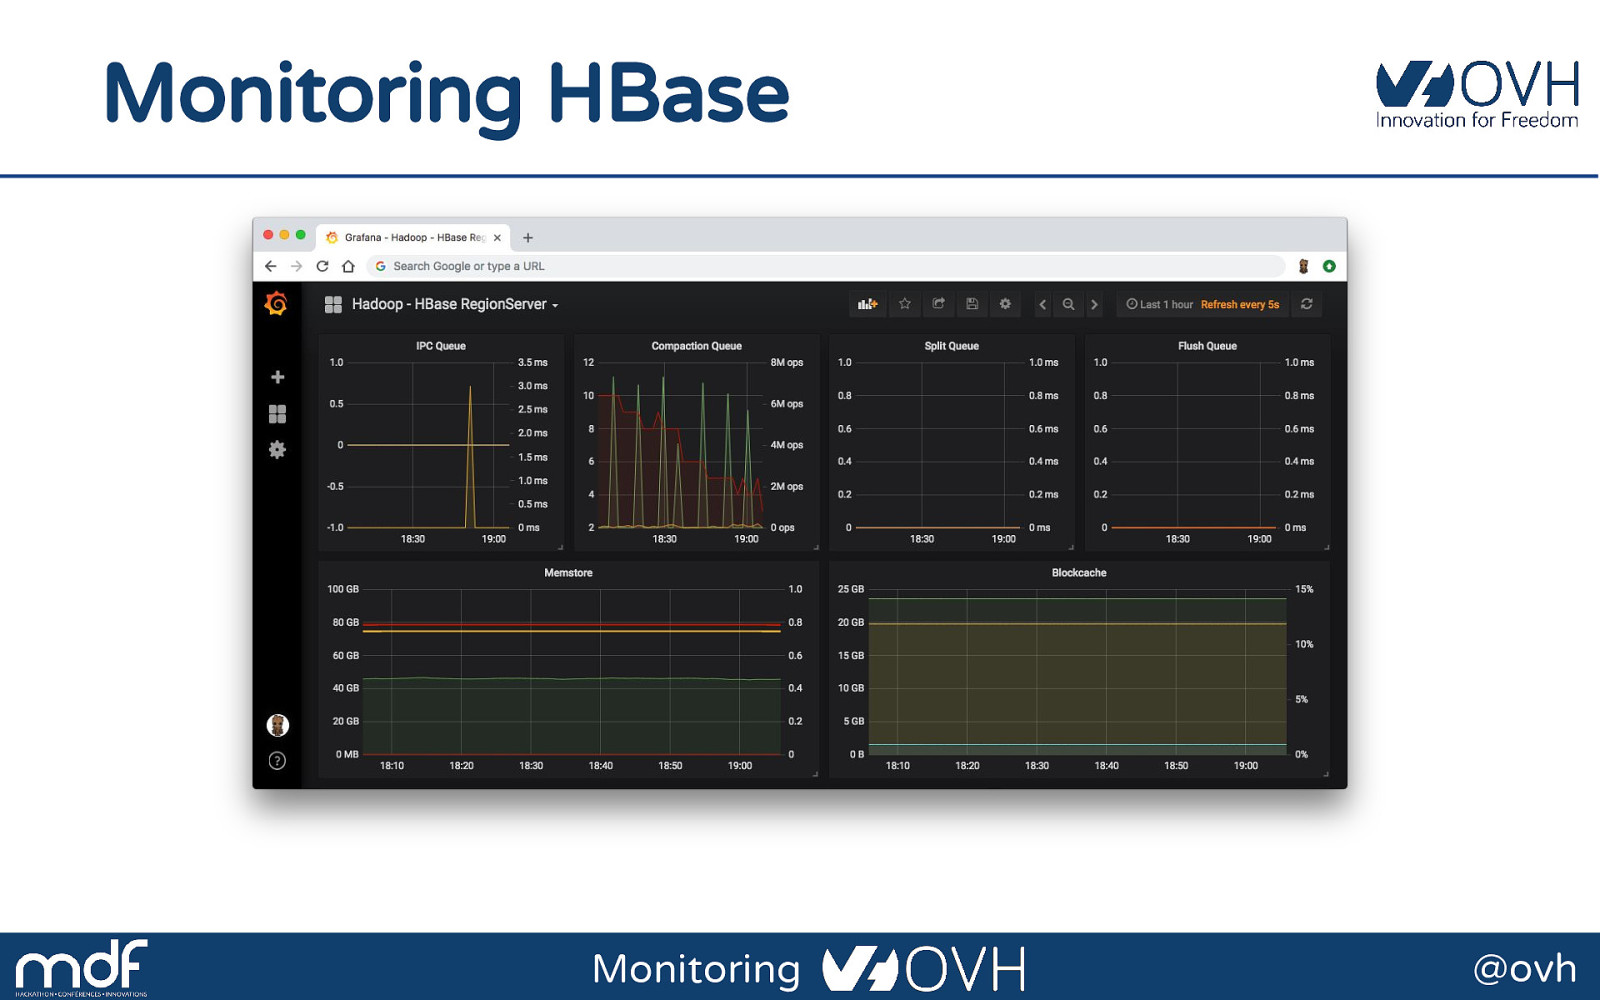
Monitoring HBase Monitoring @ovh
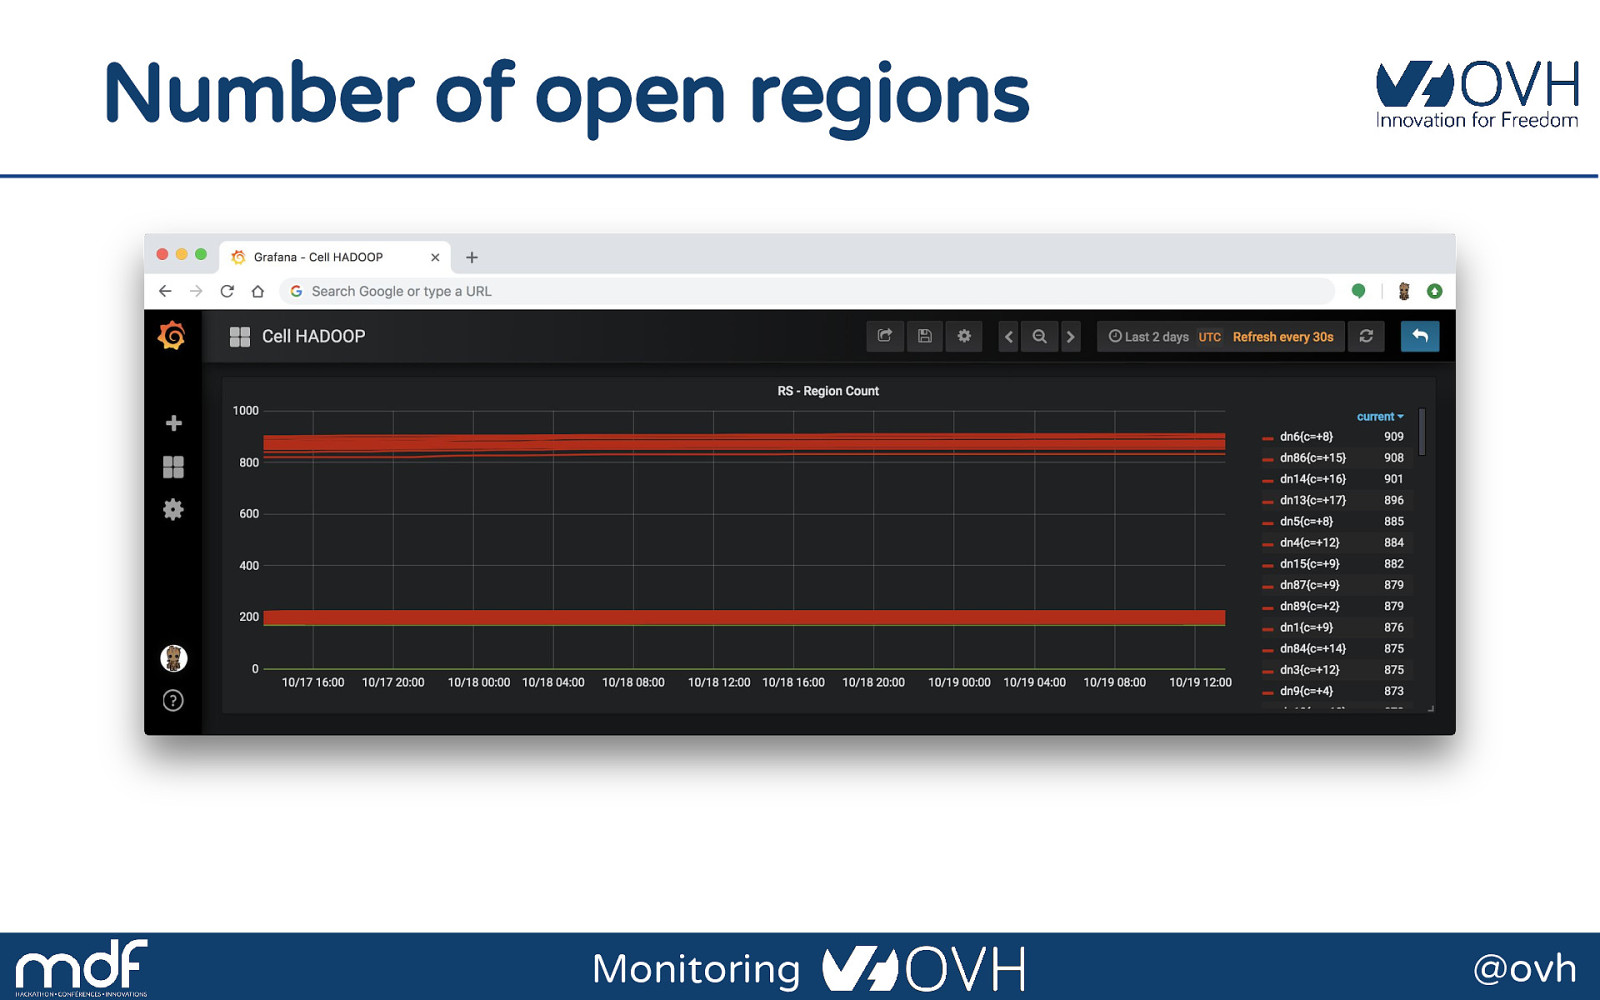
Number of open regions Monitoring @ovh
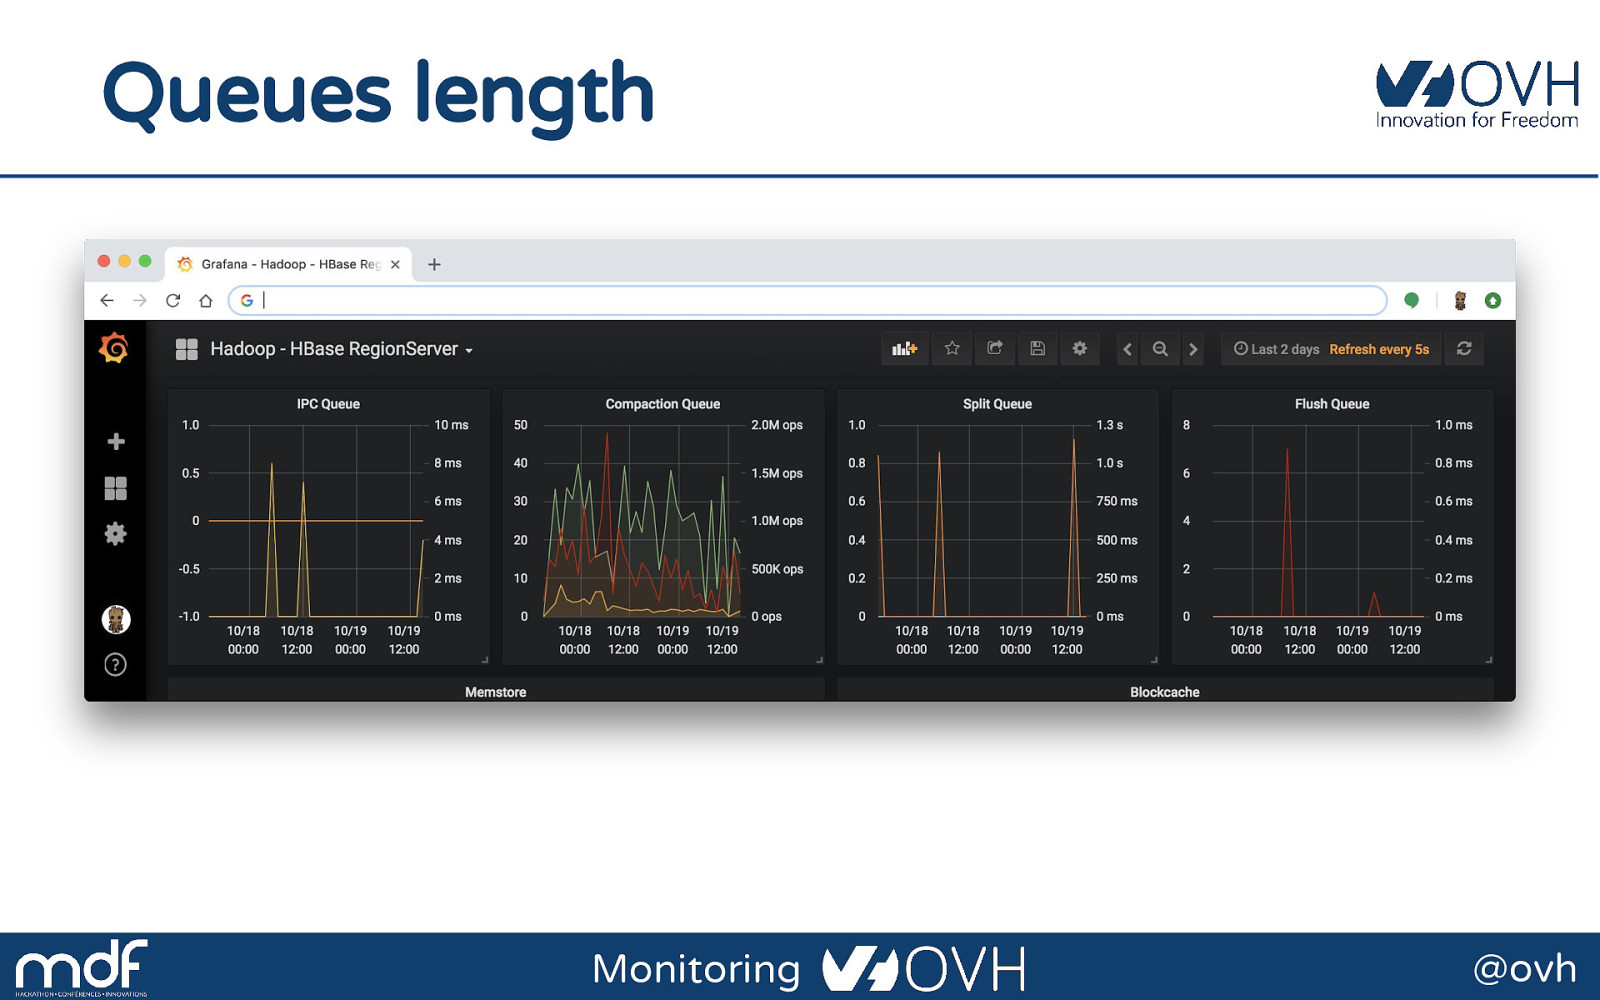
Queues length Monitoring @ovh
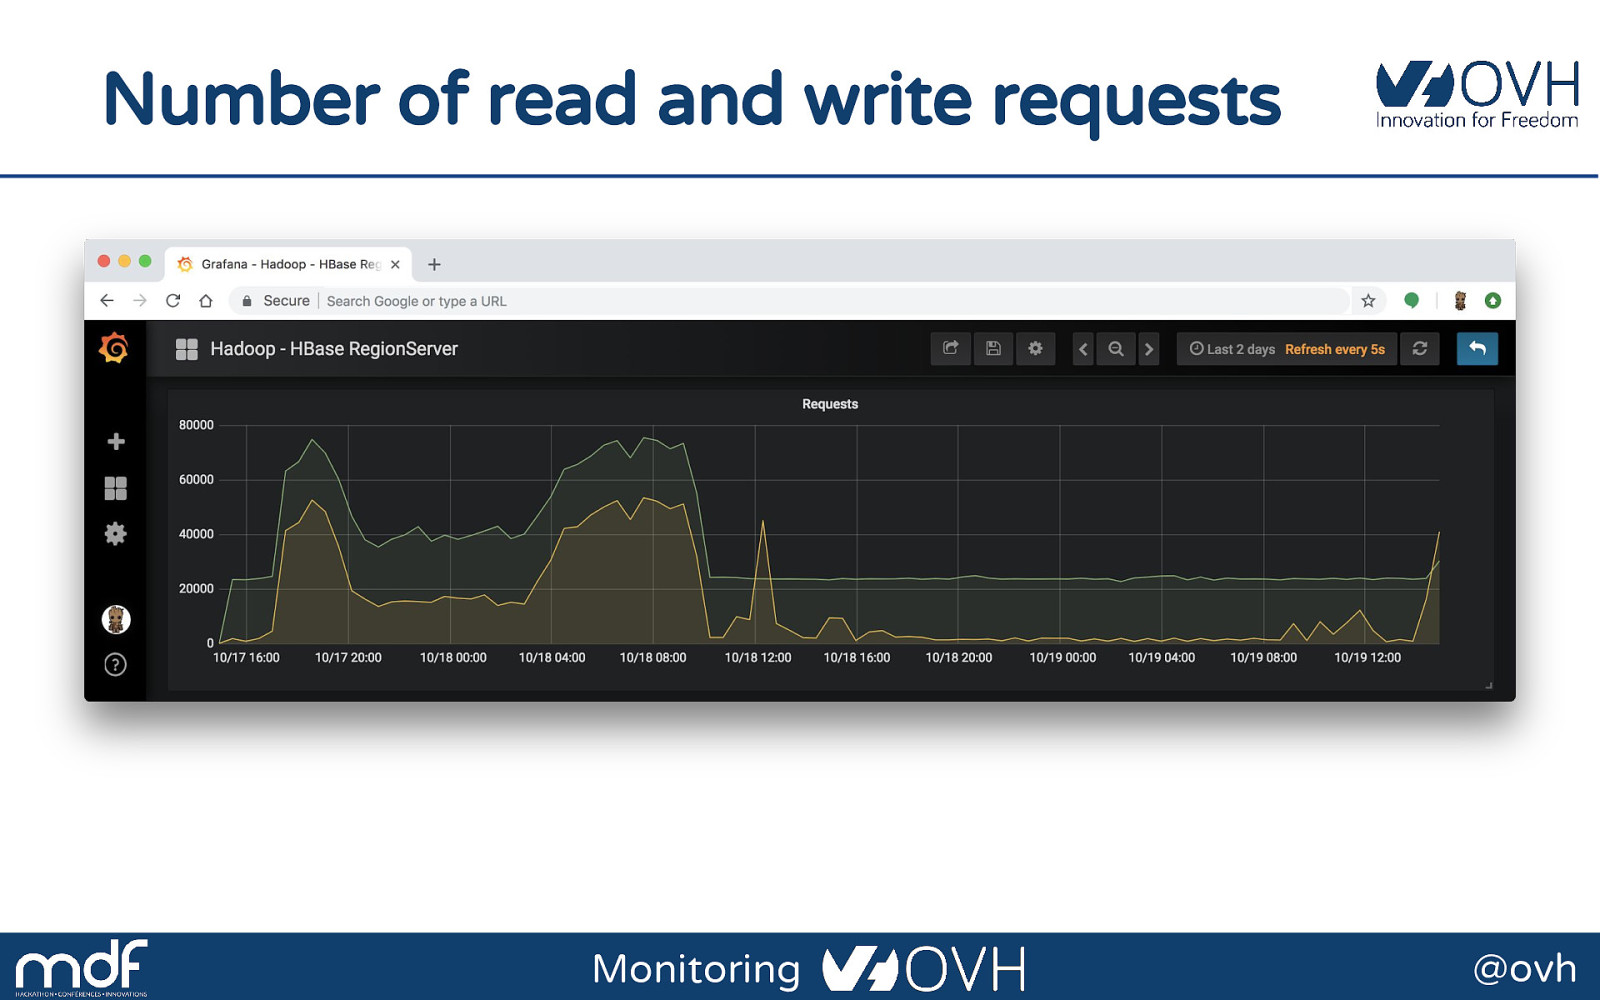
Number of read and write requests Monitoring @ovh
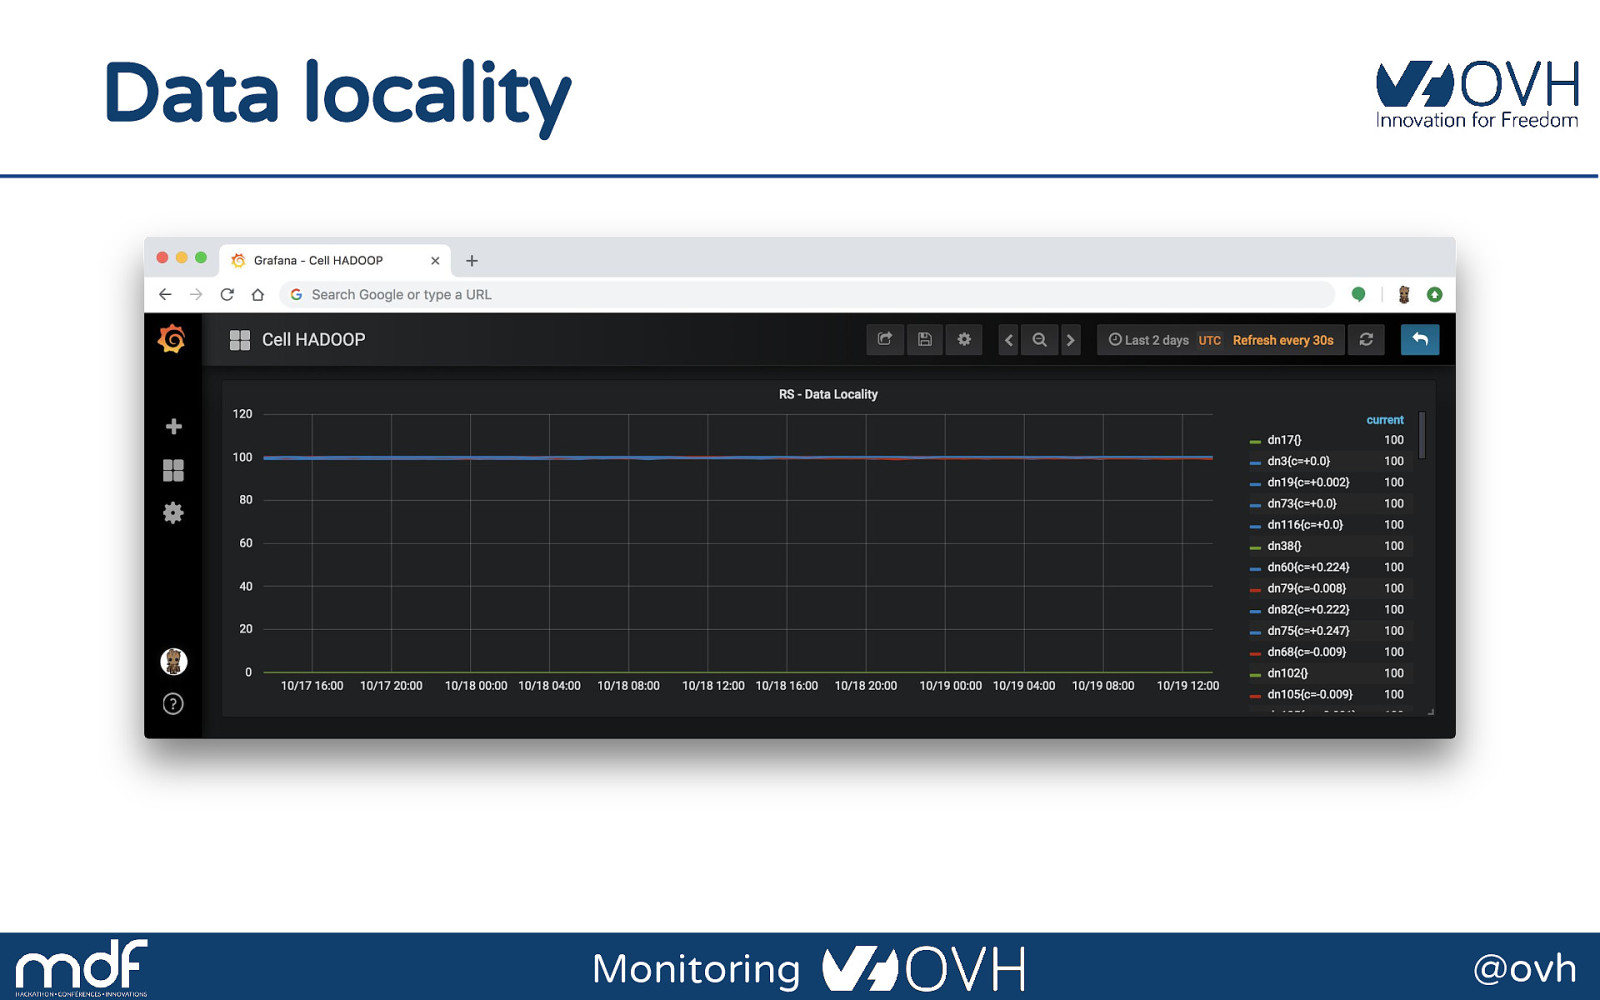
Data locality Monitoring @ovh
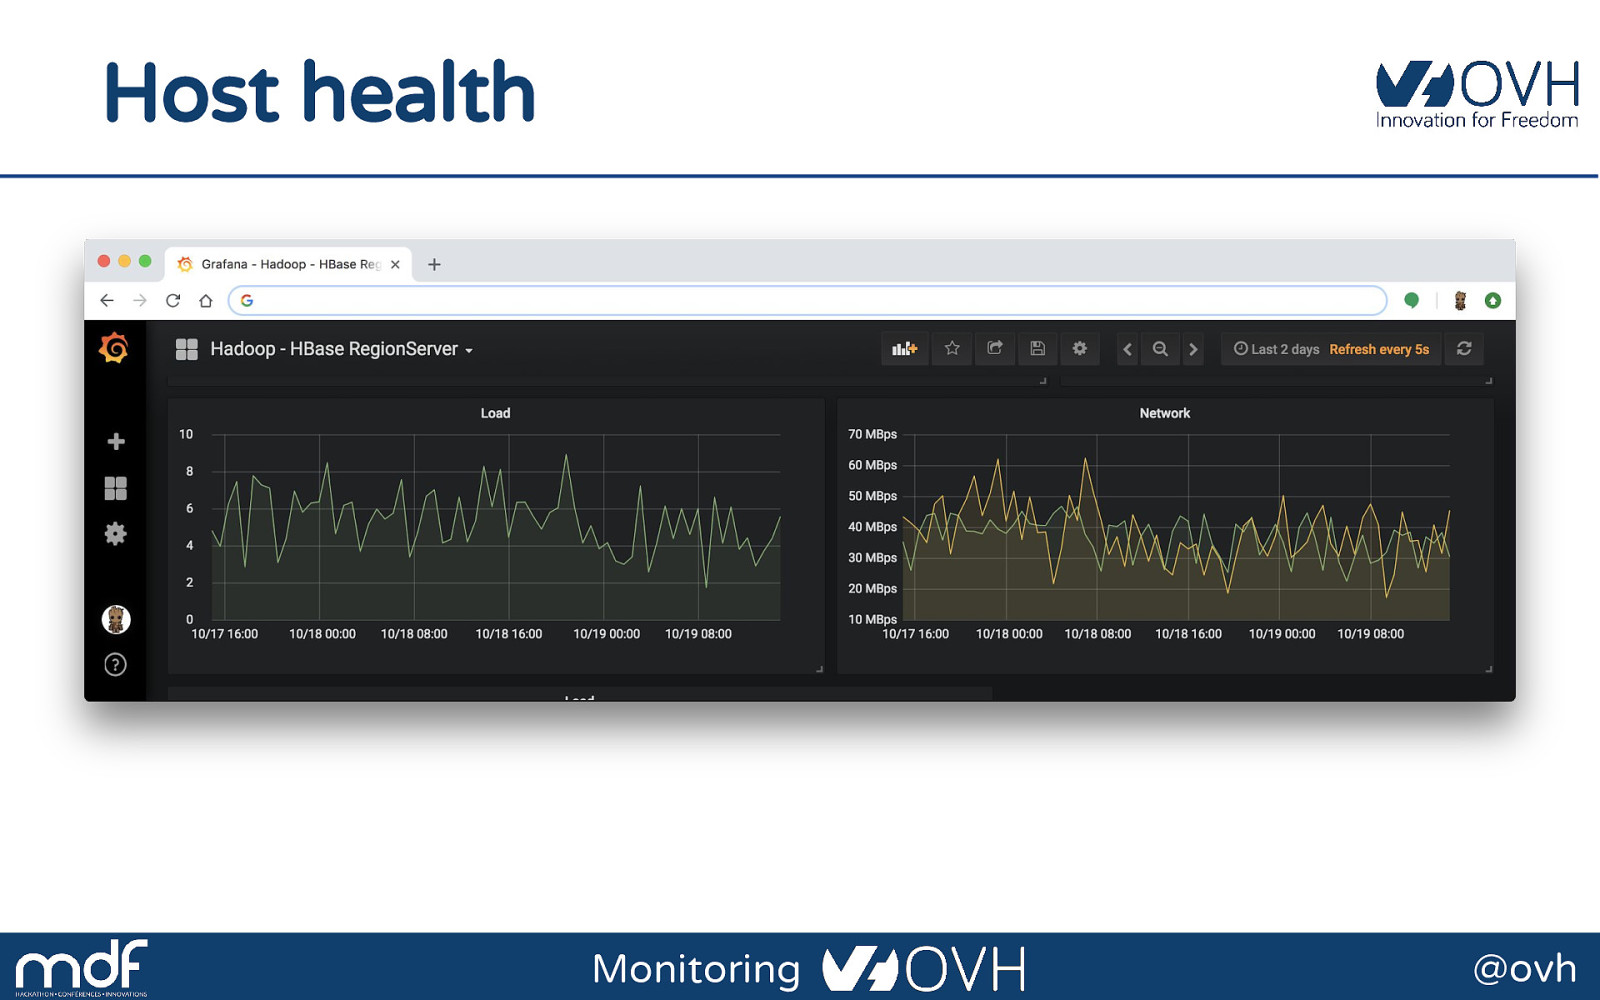
Host health Monitoring @ovh
Pokédex & Pokeball Inventory all animals. Monitoring @ovh
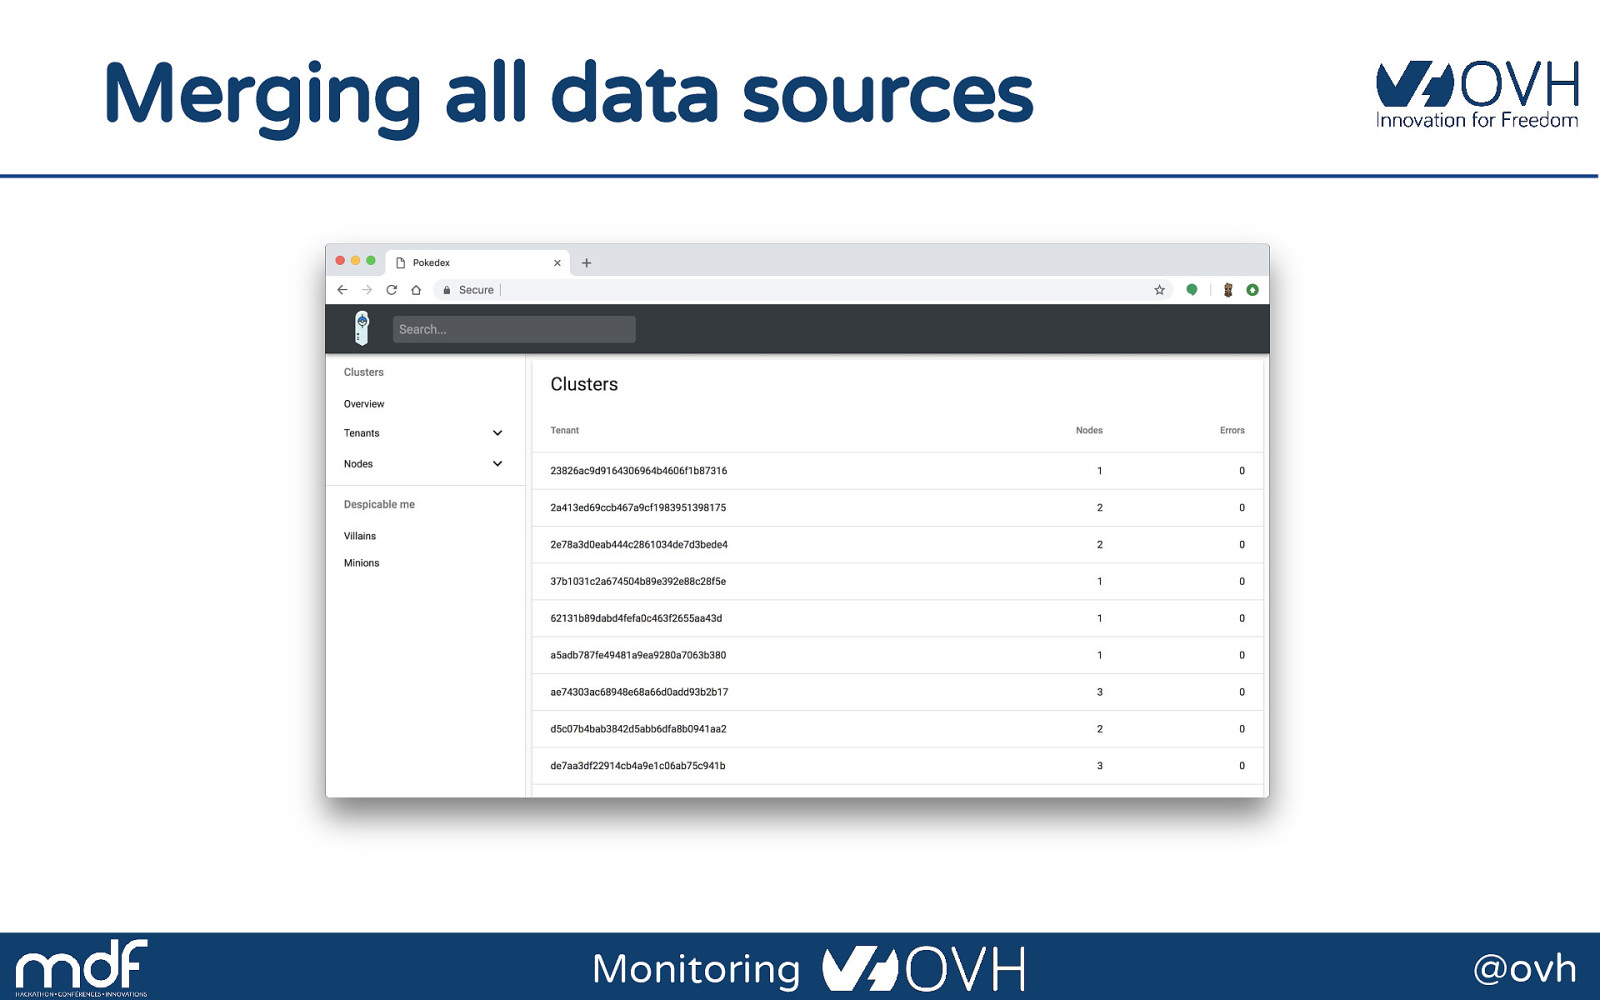
Merging all data sources Monitoring @ovh
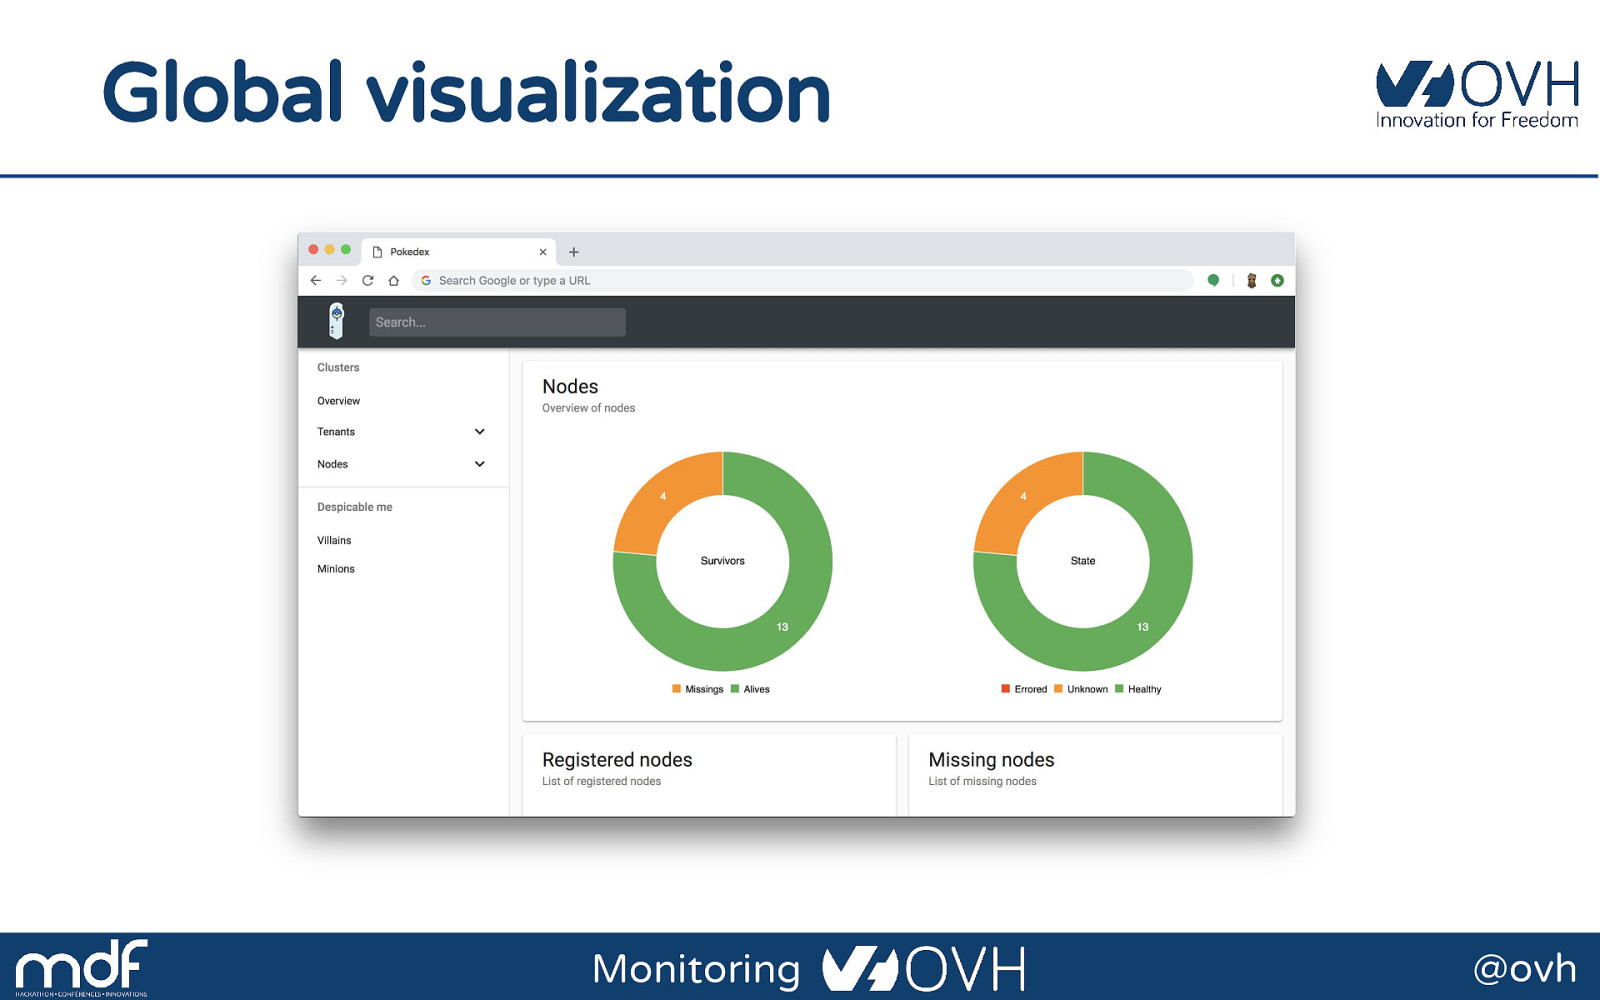
Global visualization Monitoring @ovh
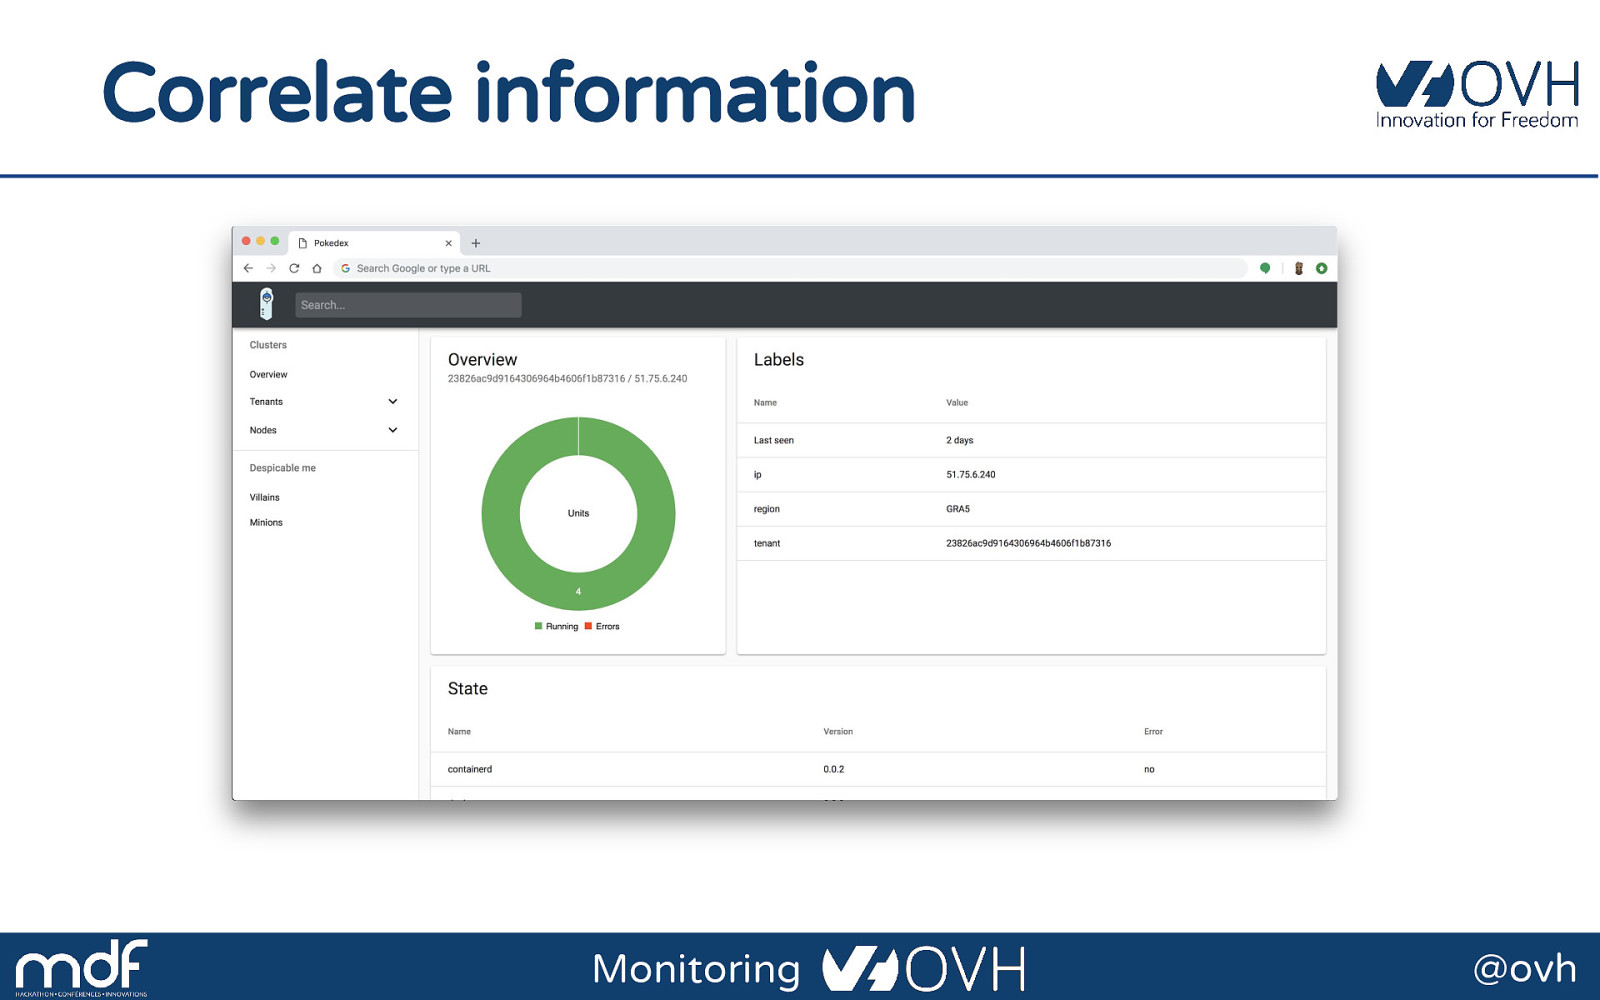
Correlate information Monitoring @ovh
Sacha The best tamer Monitoring 112 @ovh
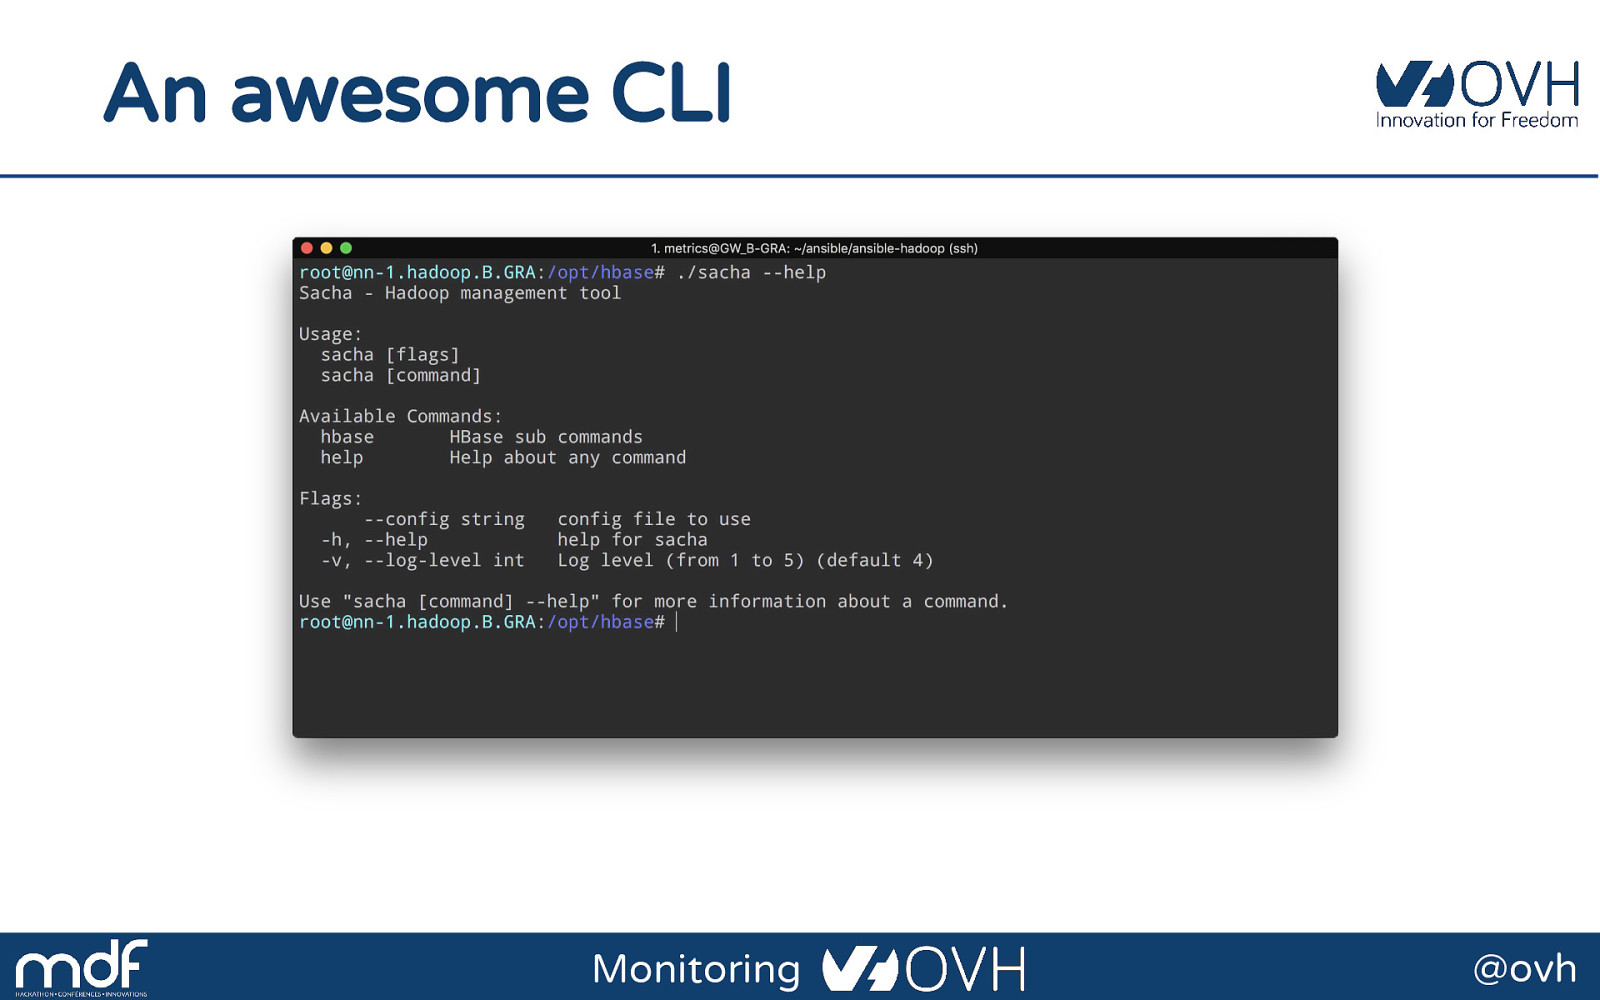
An awesome CLI Monitoring @ovh
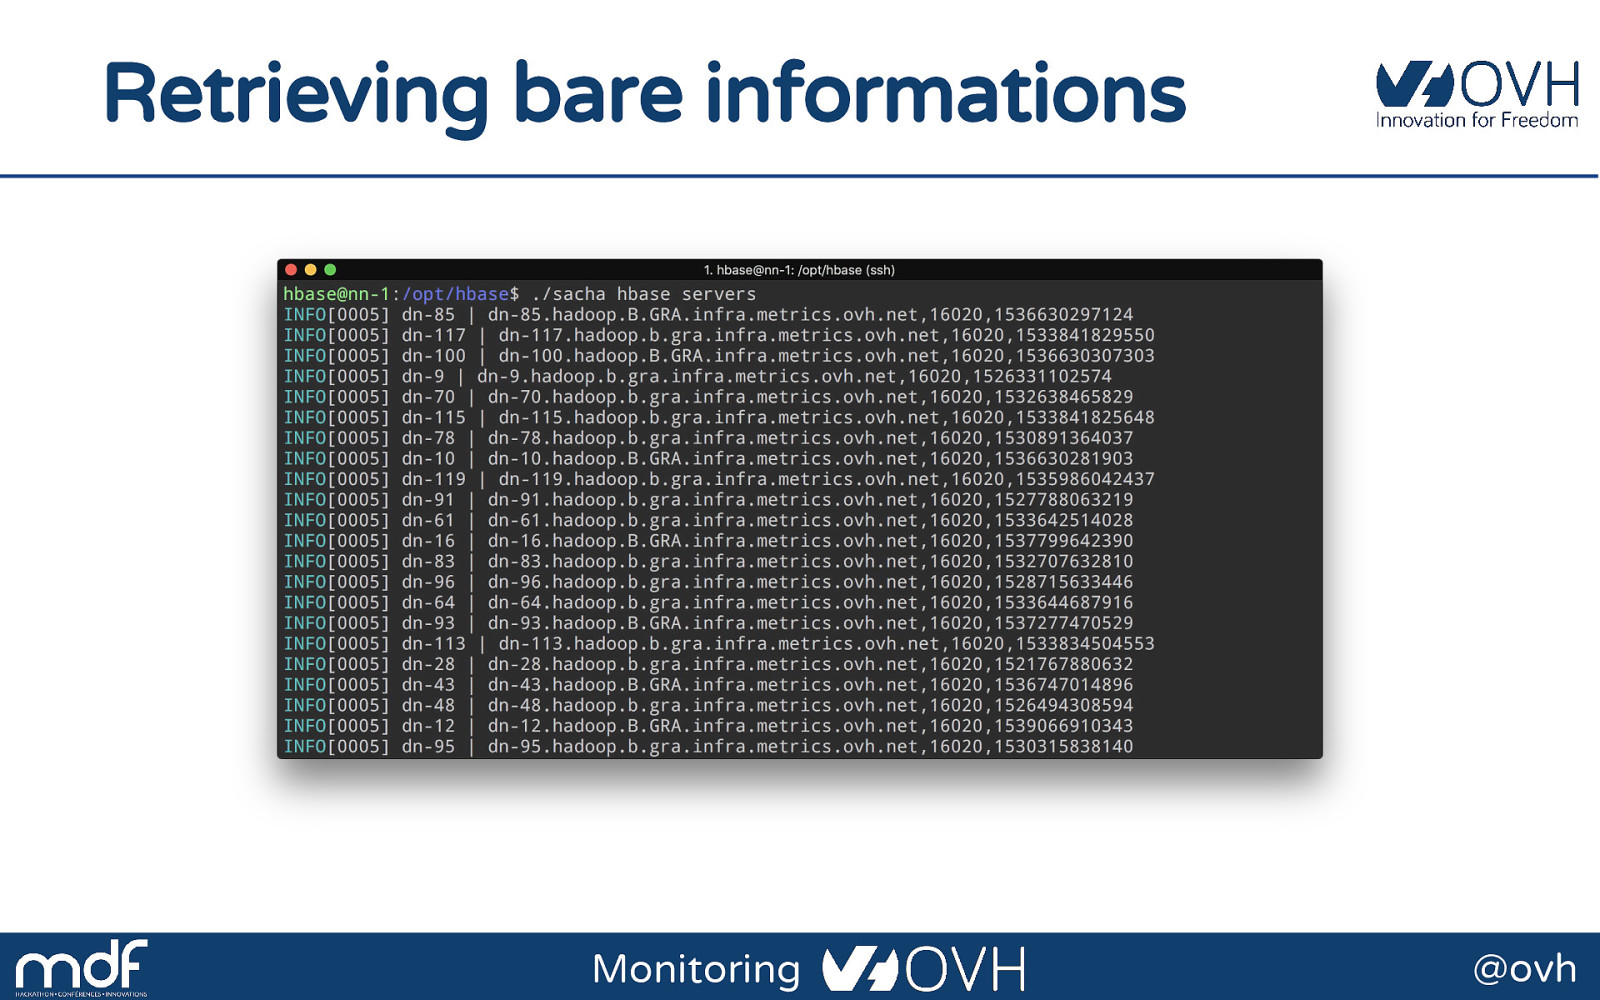
Retrieving bare informations Monitoring @ovh
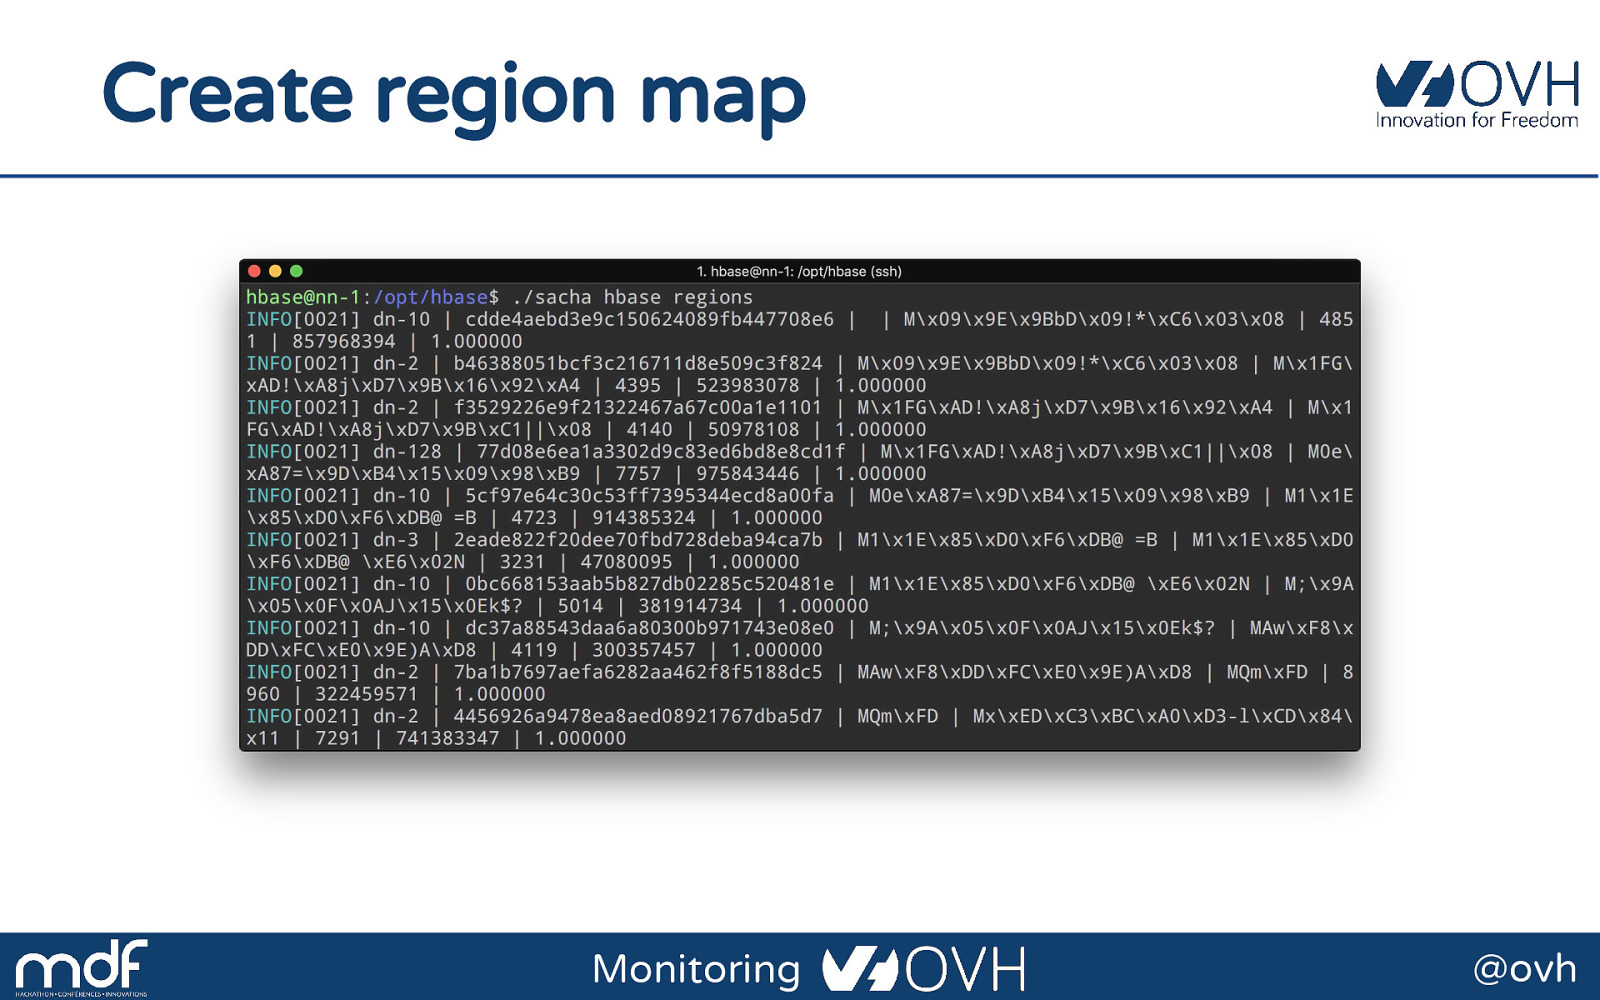
Create region map Monitoring @ovh
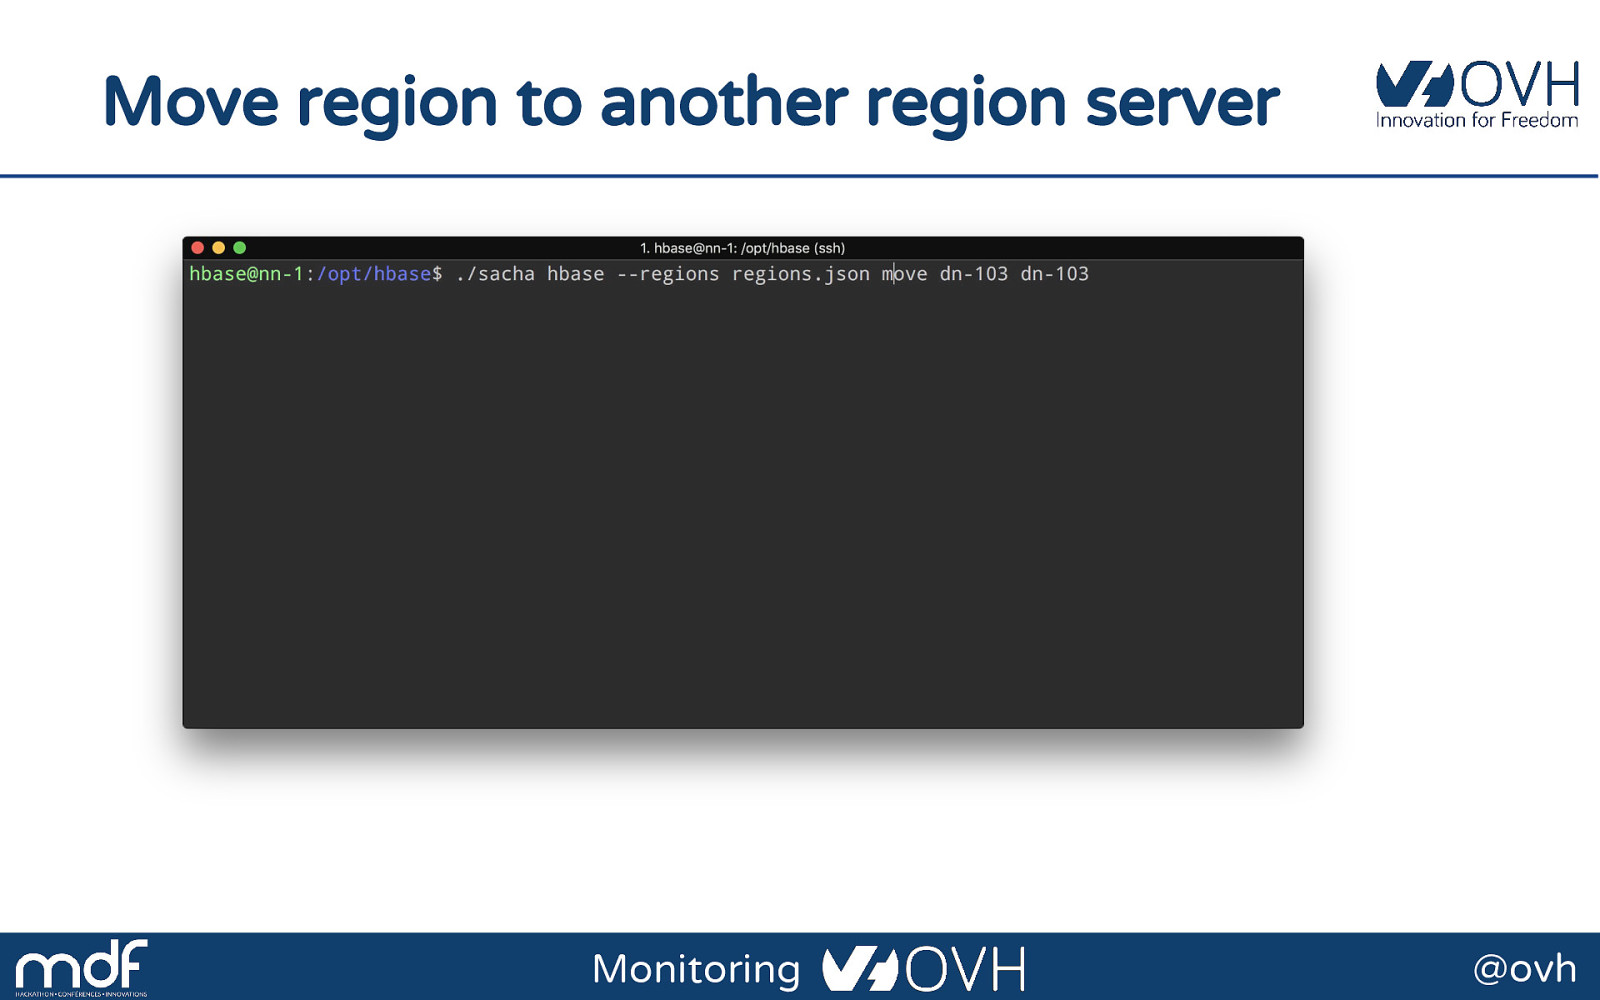
Move region to another region server Monitoring @ovh
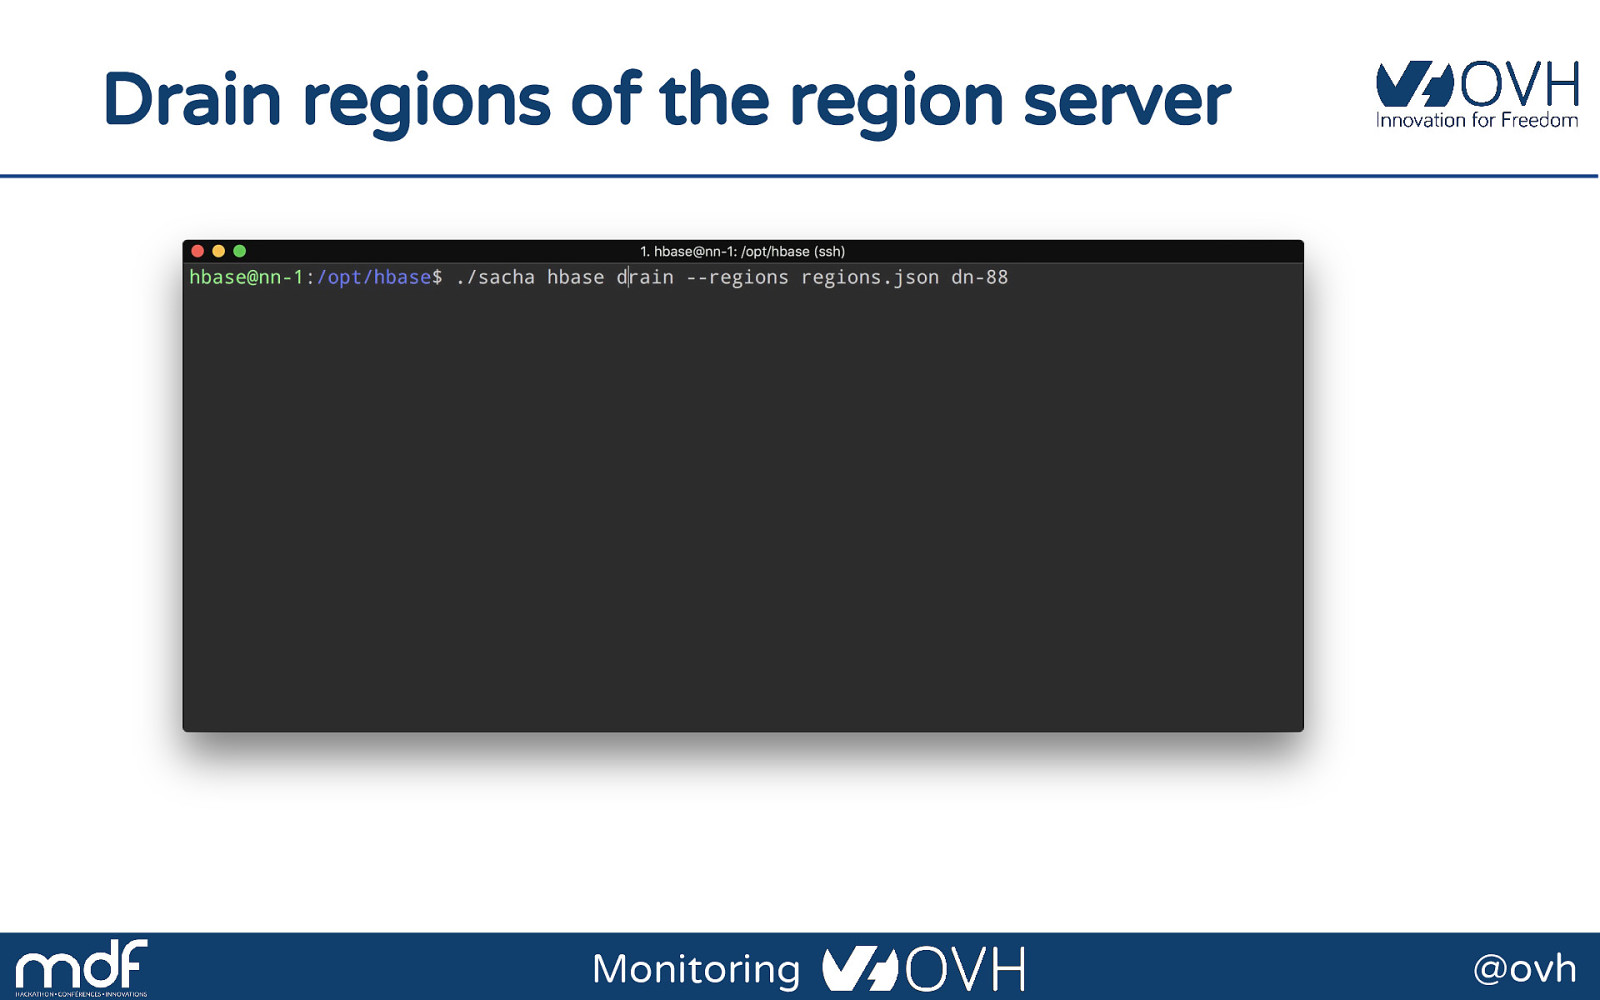
Drain regions of the region server Monitoring @ovh
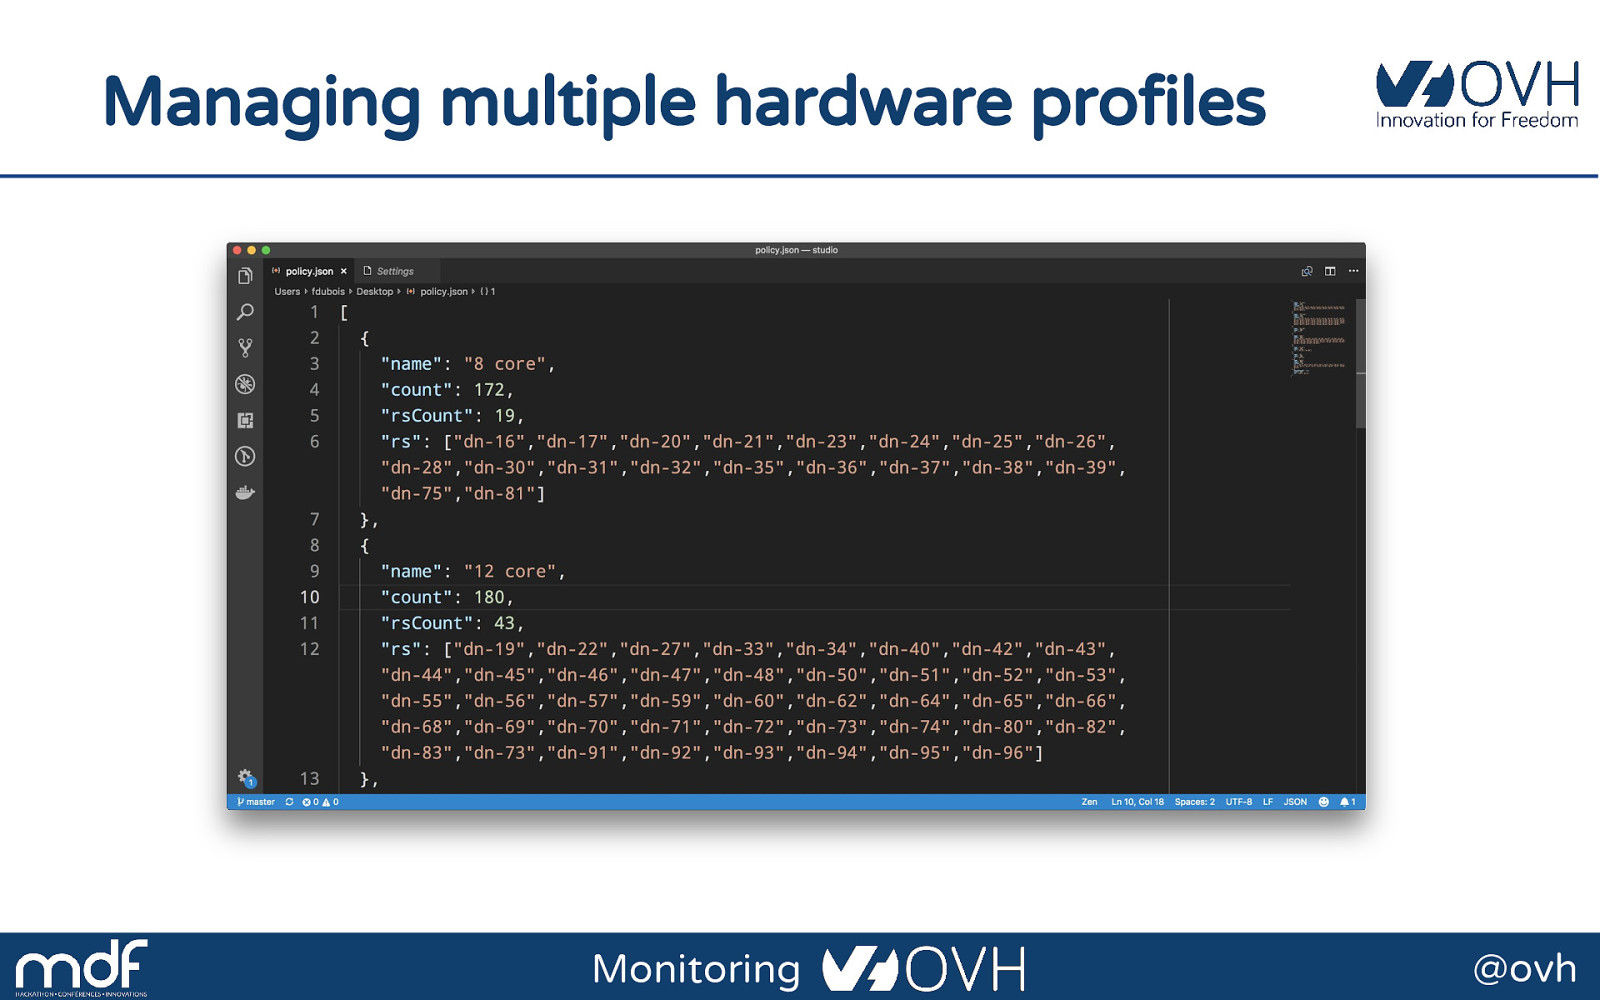
Managing multiple hardware profiles Monitoring @ovh
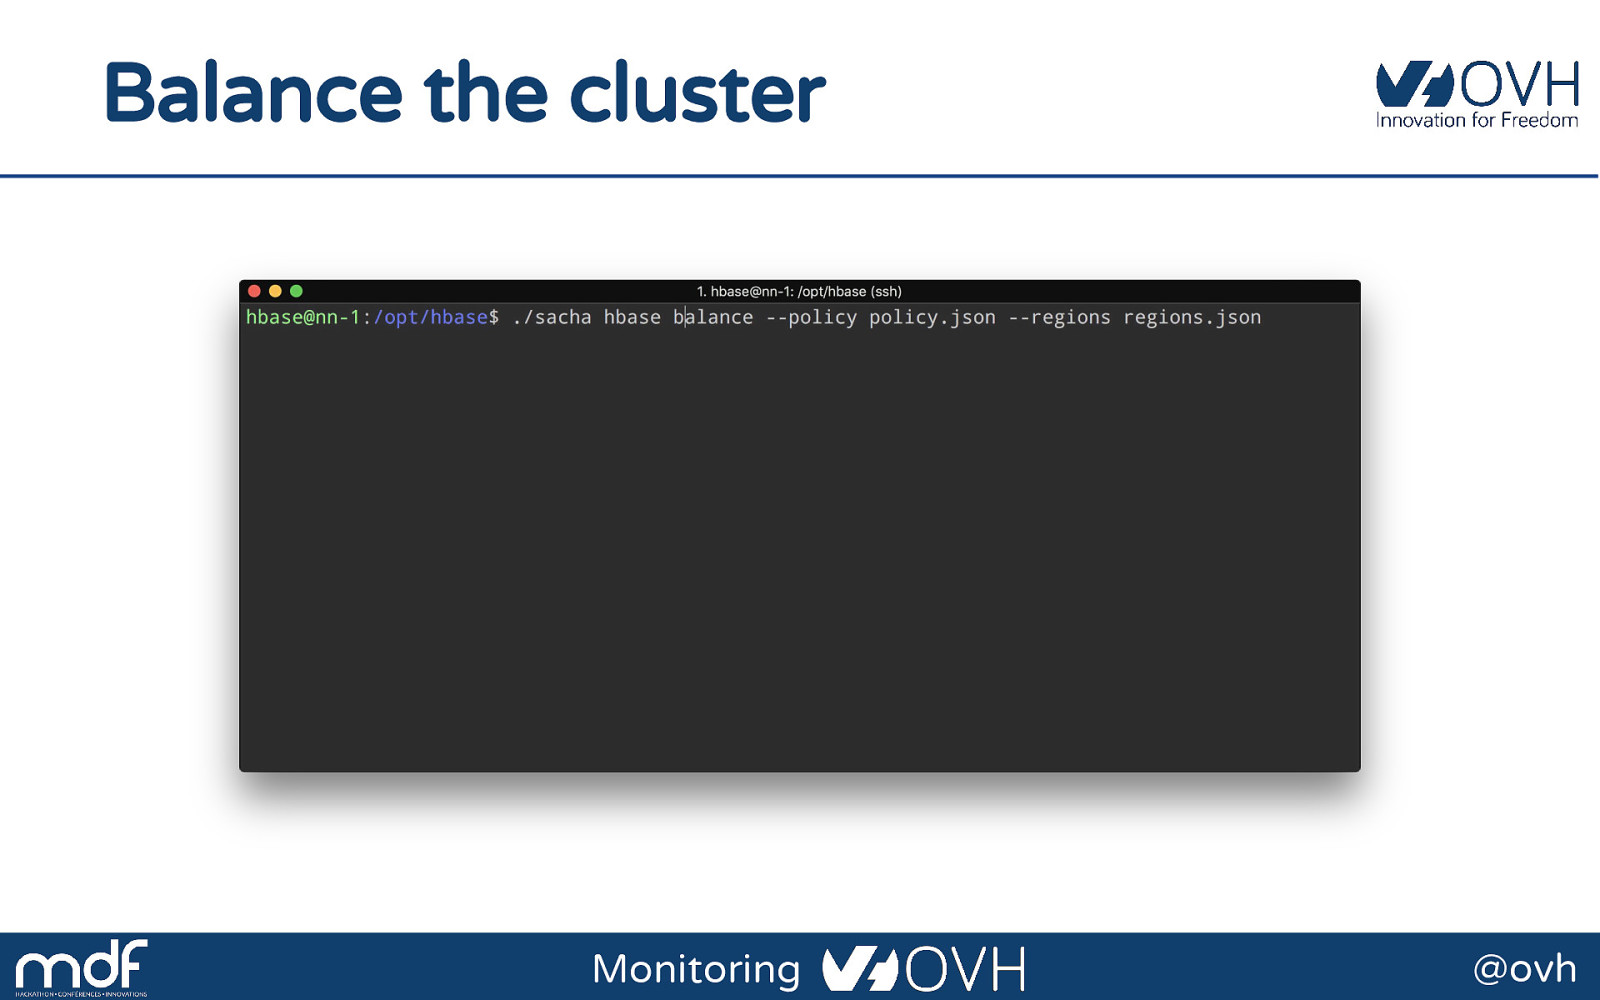
Balance the cluster Monitoring @ovh
Conclusion That's all folks! Monitoring @ovh

What to do when you must monitor the whole infrastructure of the biggest European hosting and cloud provider? How to choose a tool when the most used ones fail to scale to your needs? How to build an Metrics platform to unify, conciliate and replace years of fragmented legacy partial solutions?
In this talk we will relate our experience building and maintaining OVH Metrics, the platform used to monitor all OVH infrastructure. We needed to go to places where most monitoring solutions hadn’t gone before, it needed to operate at the scale of the biggest European hosting and cloud providers: 27 data centers, more than 300k servers (bare metal!), and hundreds of products to fulfill our mission to host 1.3 million customers.
You will hear about time series, about open source solutions pushed to the limit, about HBase clusters operated at the extreme, and how about a small team leveraged the power of a handful of open source solution and lots of coding glue to build one of the most performant monitoring solutions ever.