
A presentation at Container Days Conference in in Hamburg, Germany by Kasper Borg Nissen
Container Days Hamburg - September 2025 Breaking Free with Open Standards: OpenTelemetry and Perses for Observability Kasper Borg Nissen, Developer Advocate at @phennex kaspernissen.xyz
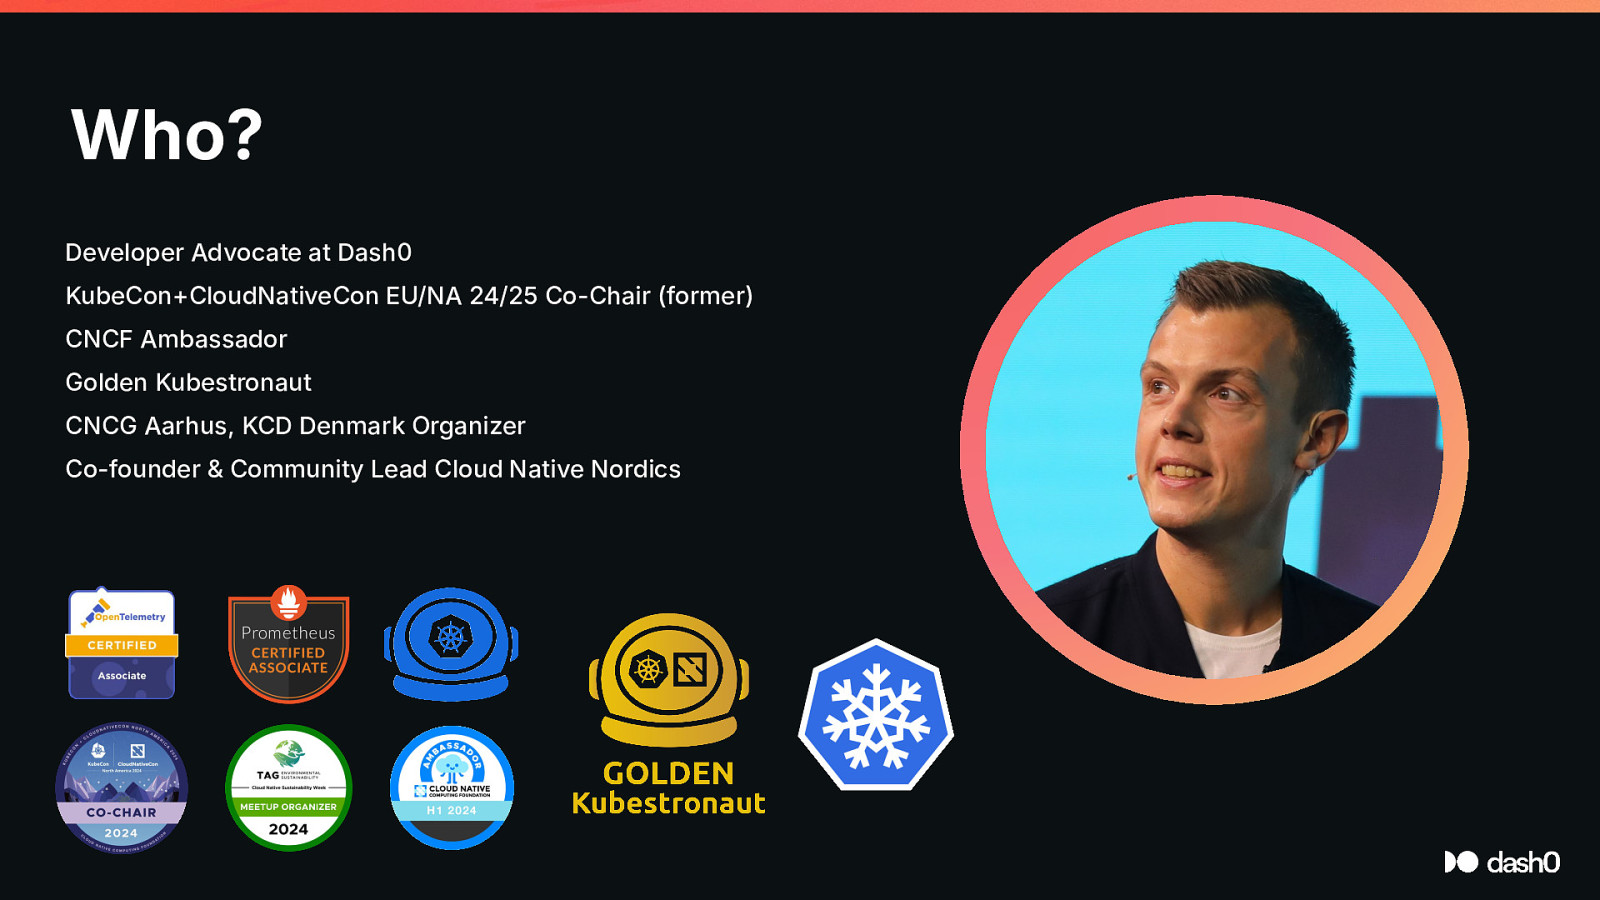
Who? Developer Advocate at Dash0 KubeCon+CloudNativeCon EU/NA 24/25 Co-Chair (former) CNCF Ambassador Golden Kubestronaut CNCG Aarhus, KCD Denmark Organizer Co-founder & Community Lead Cloud Native Nordics
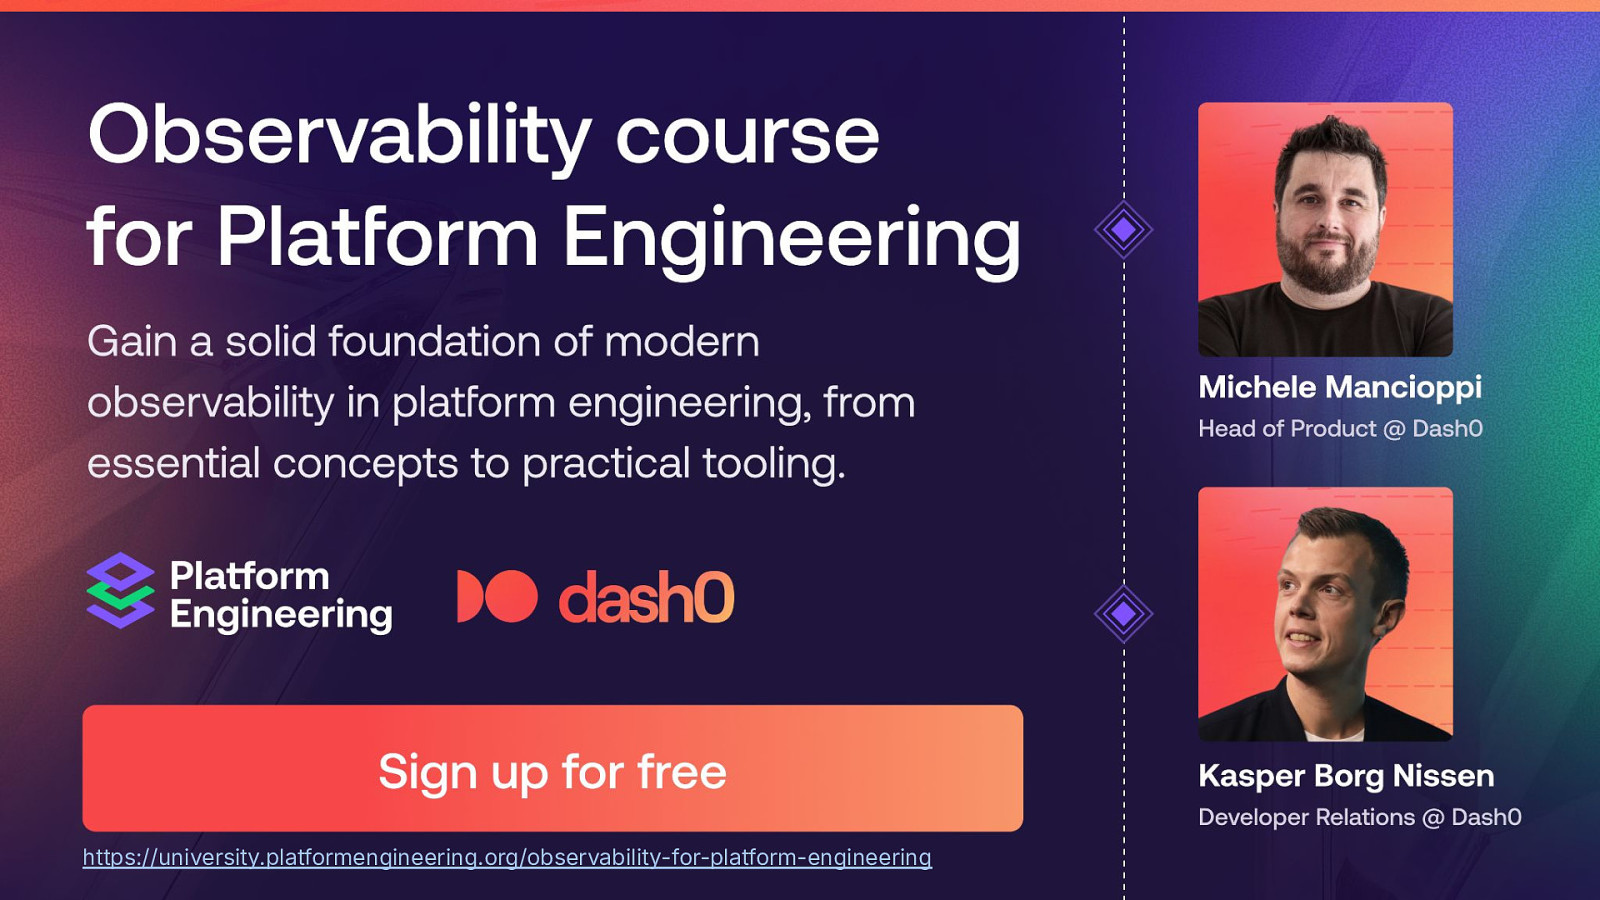
https://university.platformengineering.org/observability-for-platform-engineering
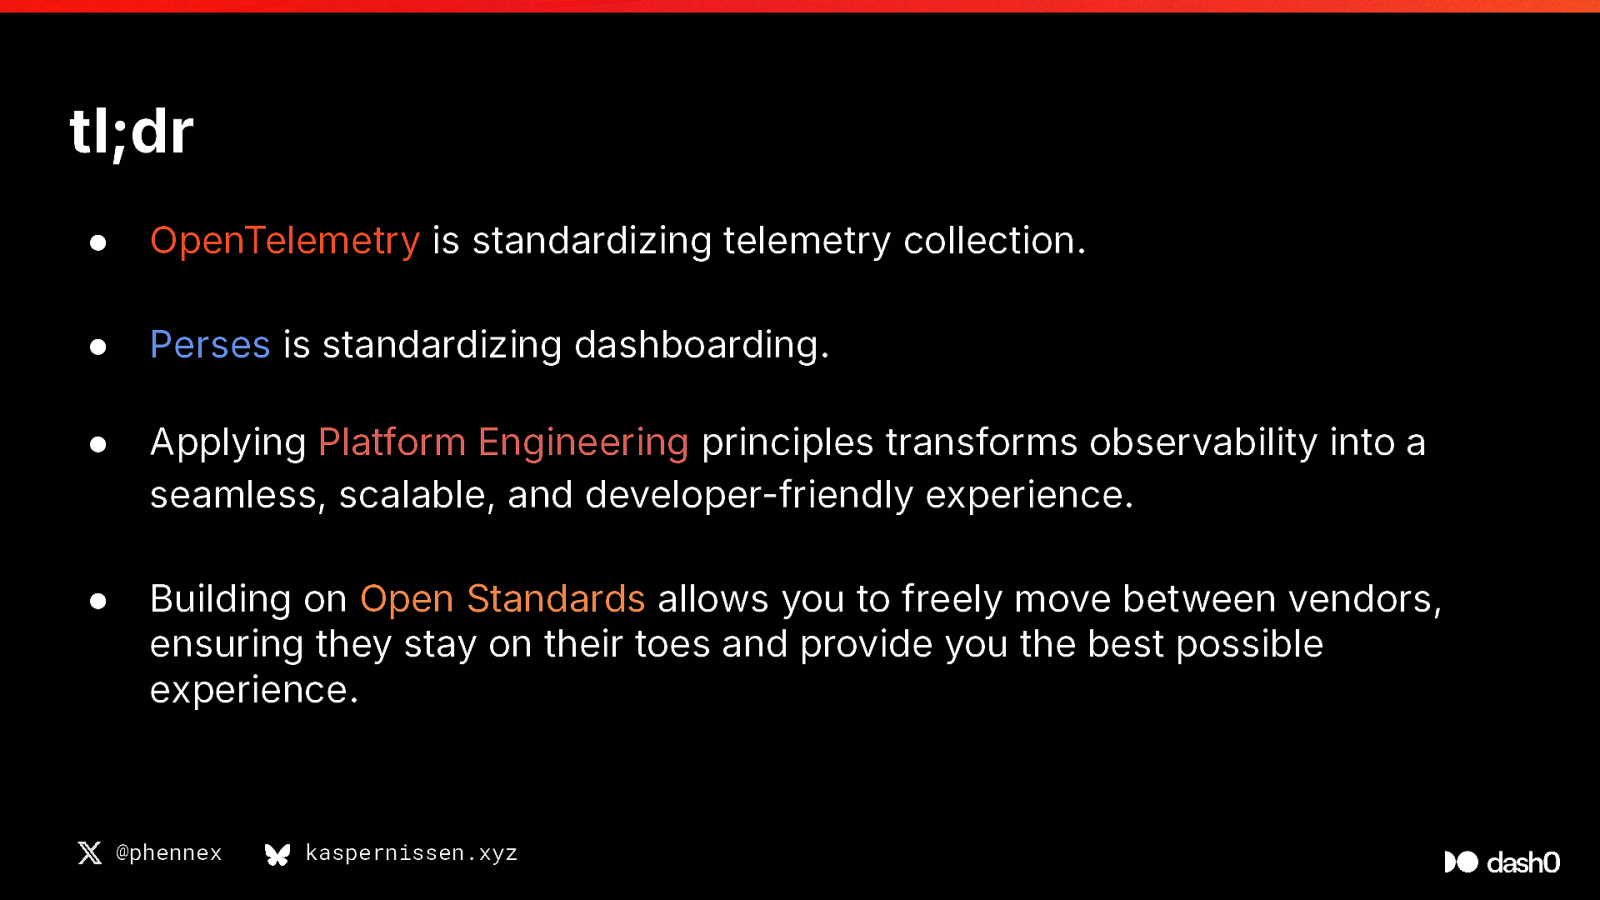
tl;dr ● OpenTelemetry is standardizing telemetry collection. ● Perses is standardizing dashboarding. ● Applying Platform Engineering principles transforms observability into a seamless, scalable, and developer-friendly experience. ● Building on Open Standards allows you to freely move between vendors, ensuring they stay on their toes and provide you the best possible experience. @phennex kaspernissen.xyz
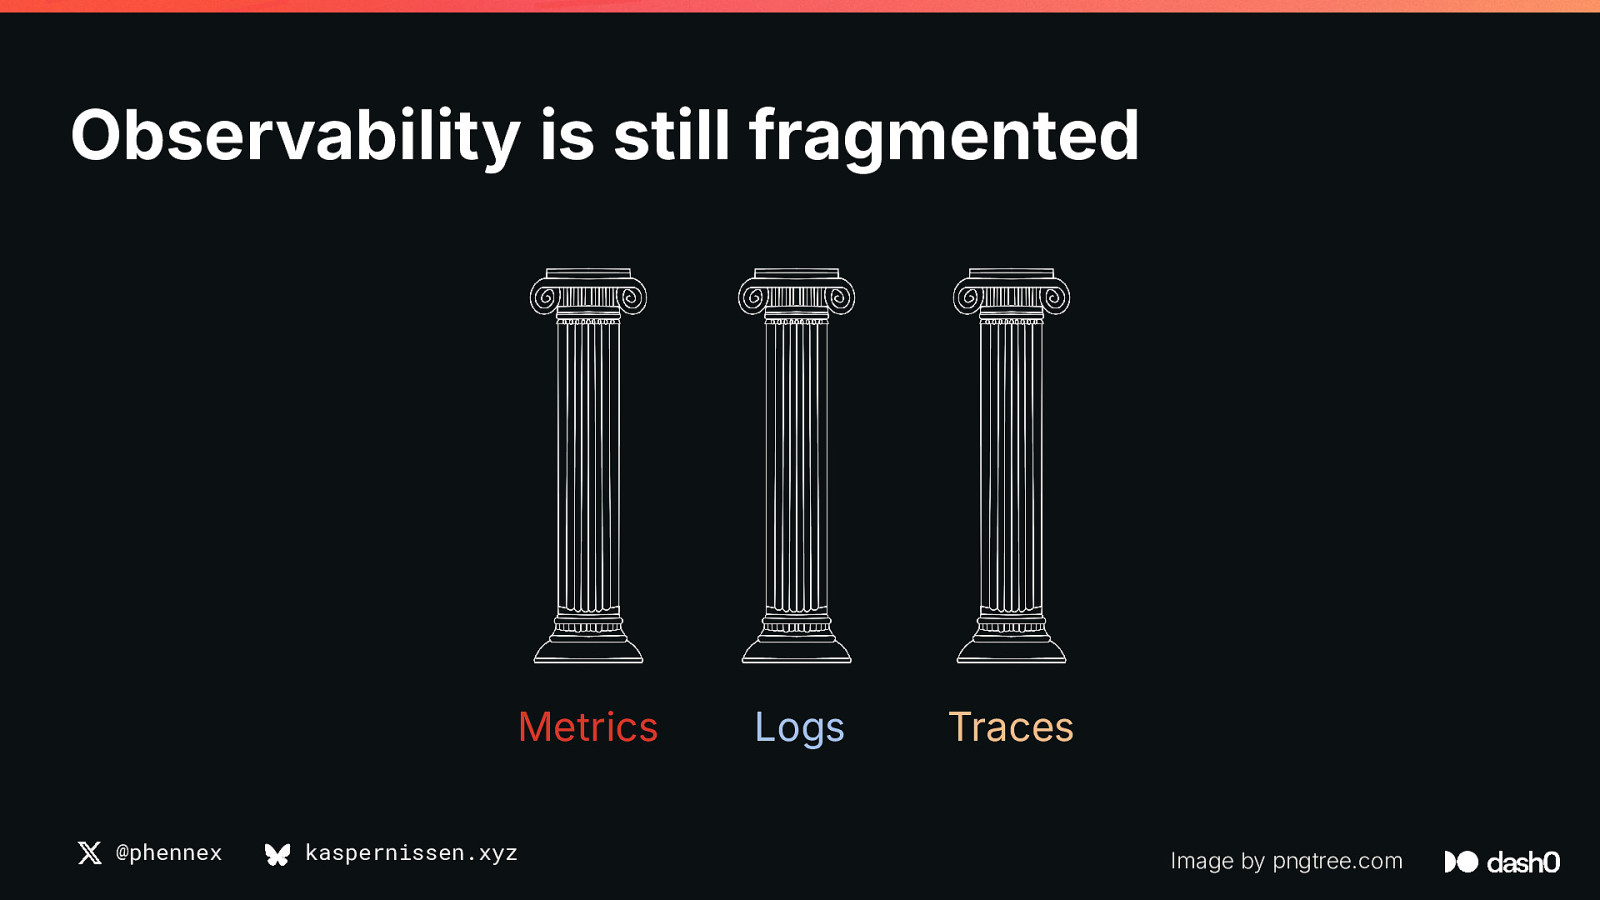
Observability is still fragmented Metrics @phennex kaspernissen.xyz Logs Traces Image by pngtree.com
Observability is still fragmented We donʼt have a metrics problem, or a tracing problem. We have systems problems. Metrics @phennex kaspernissen.xyz Logs Traces Image by pngtree.com
This fragmentation, leads to @phennex kaspernissen.xyz Image by pngtree.com
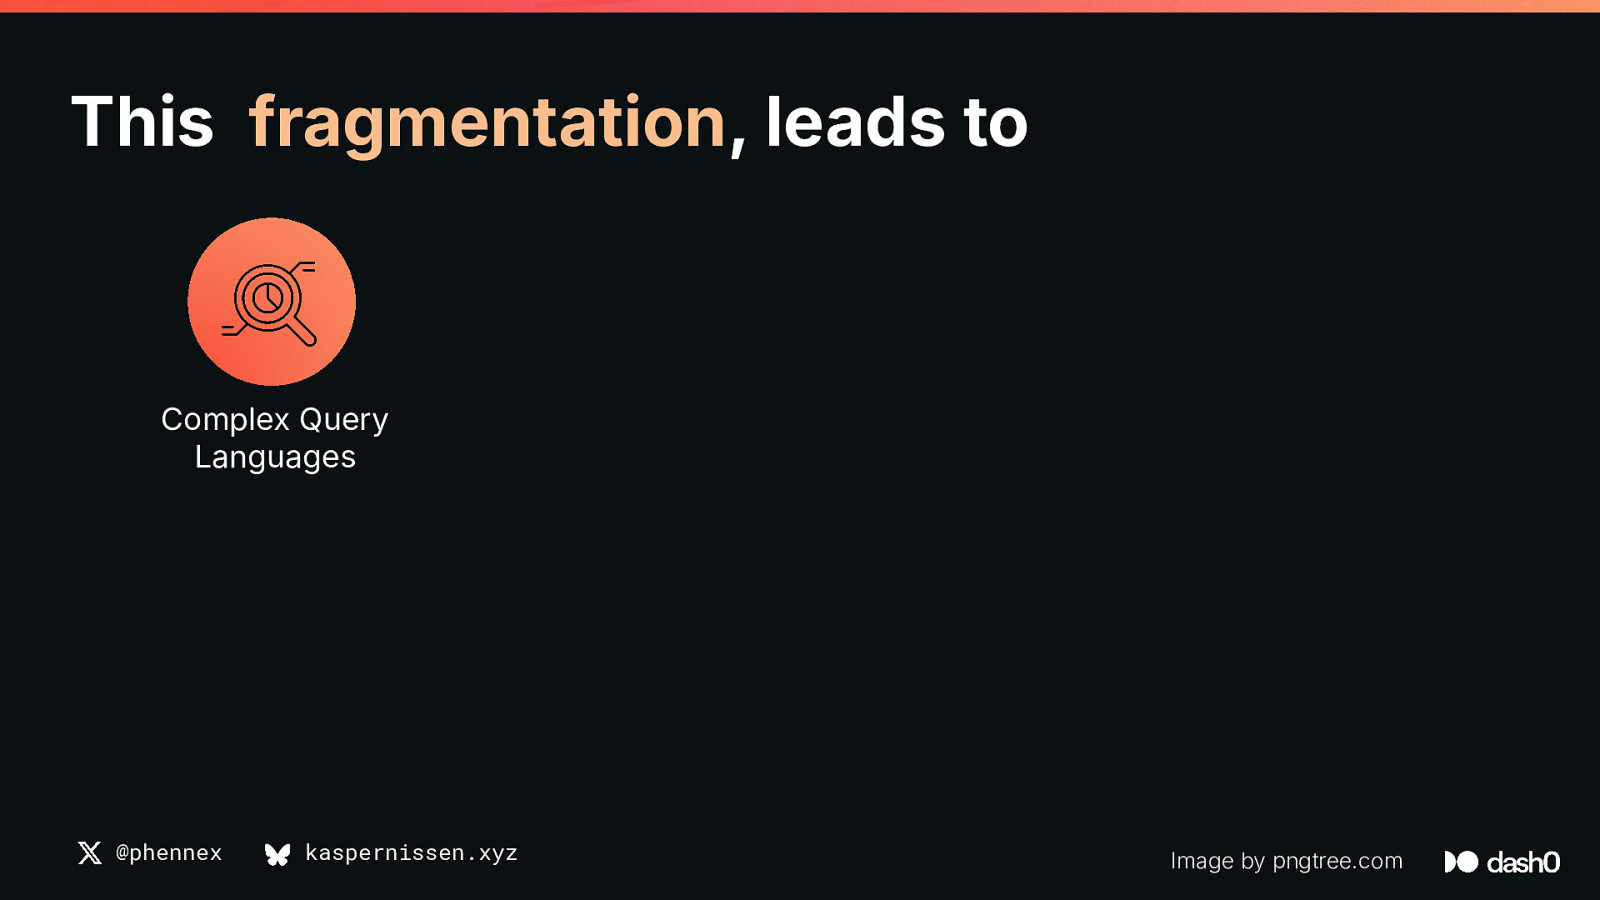
This fragmentation, leads to Complex Query Languages @phennex kaspernissen.xyz Image by pngtree.com
This fragmentation, leads to Complex Query Languages @phennex kaspernissen.xyz Vendor lock-in Image by pngtree.com
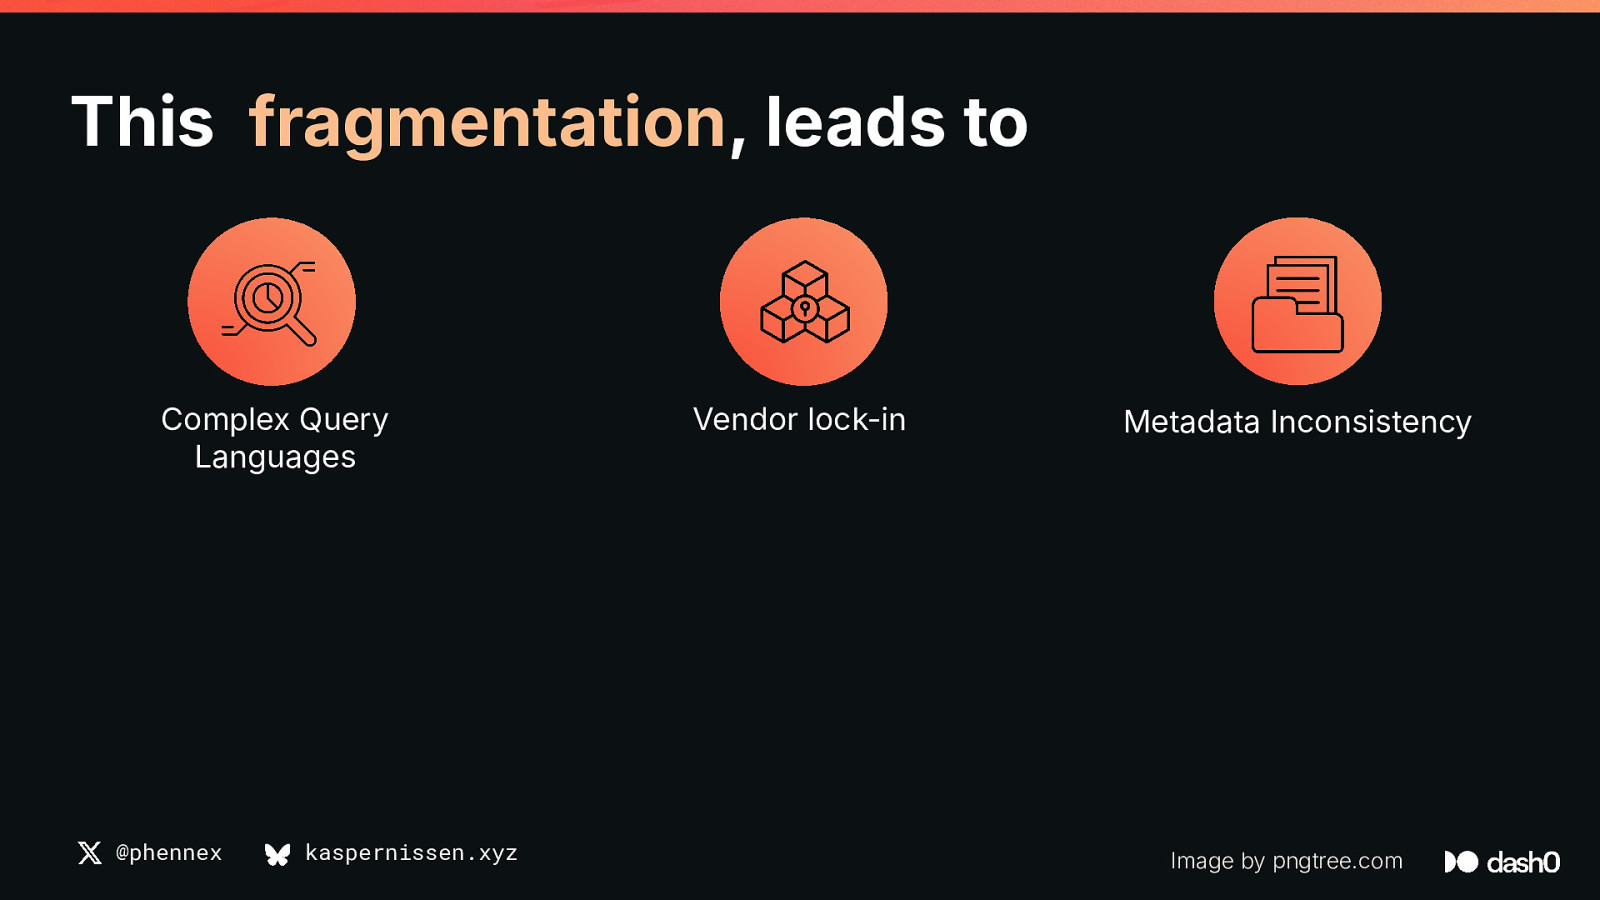
This fragmentation, leads to Complex Query Languages @phennex kaspernissen.xyz Vendor lock-in Metadata Inconsistency Image by pngtree.com
This fragmentation, leads to Complex Query Languages Vendor lock-in Metadata Inconsistency No instrumentation due to high complexity @phennex kaspernissen.xyz Image by pngtree.com
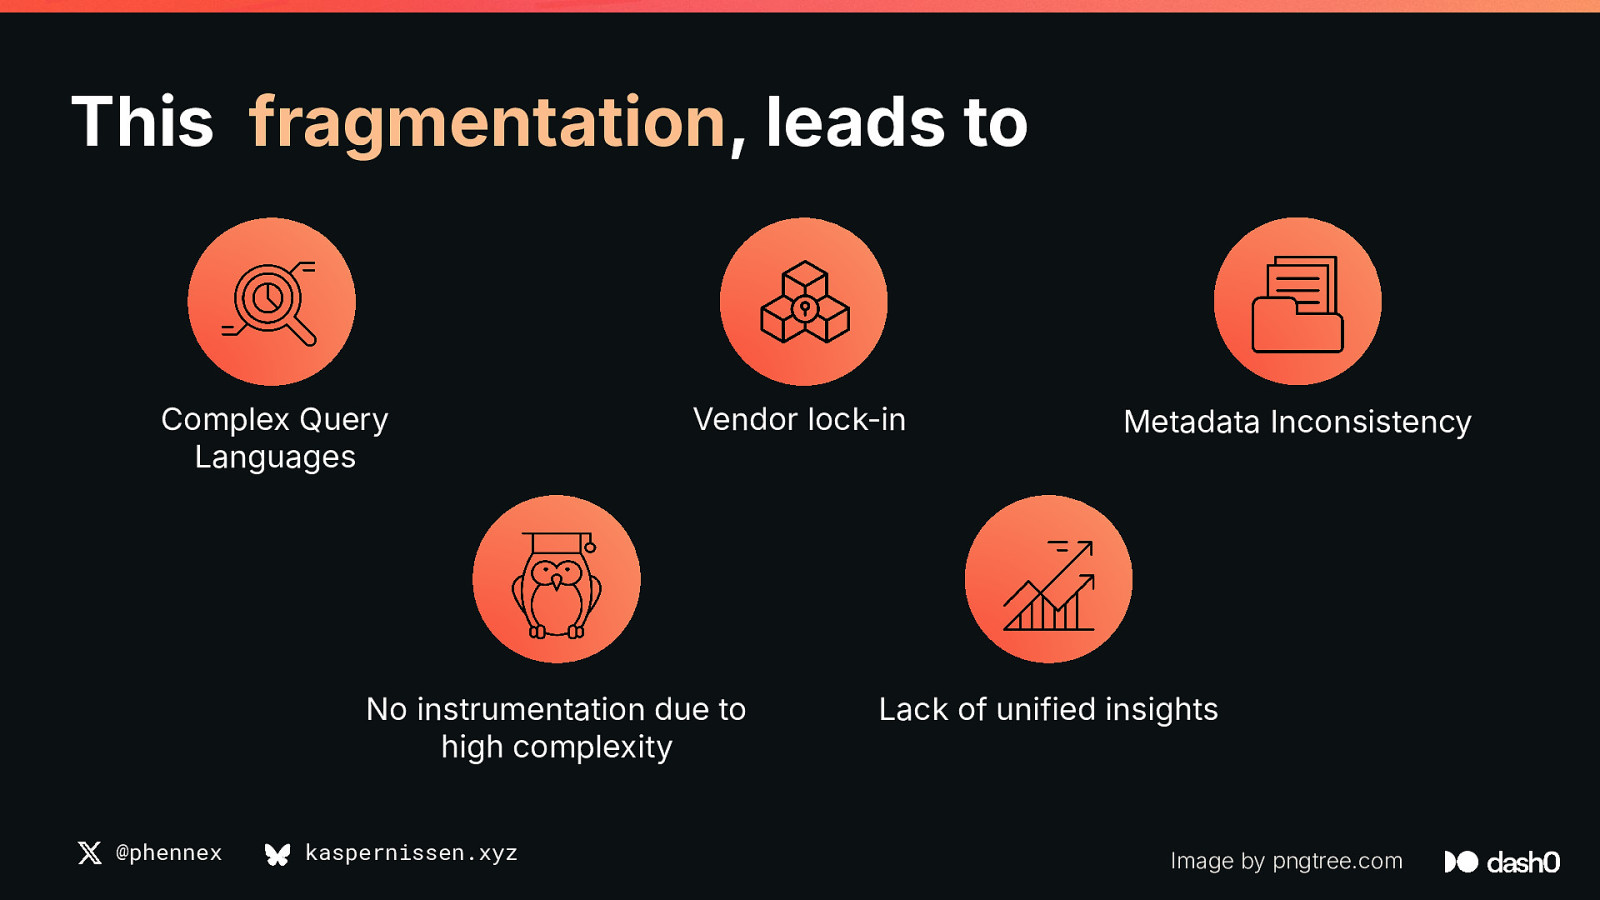
This fragmentation, leads to Complex Query Languages Vendor lock-in No instrumentation due to high complexity @phennex kaspernissen.xyz Metadata Inconsistency Lack of unified insights Image by pngtree.com
A shift is happening. @phennex kaspernissen.xyz
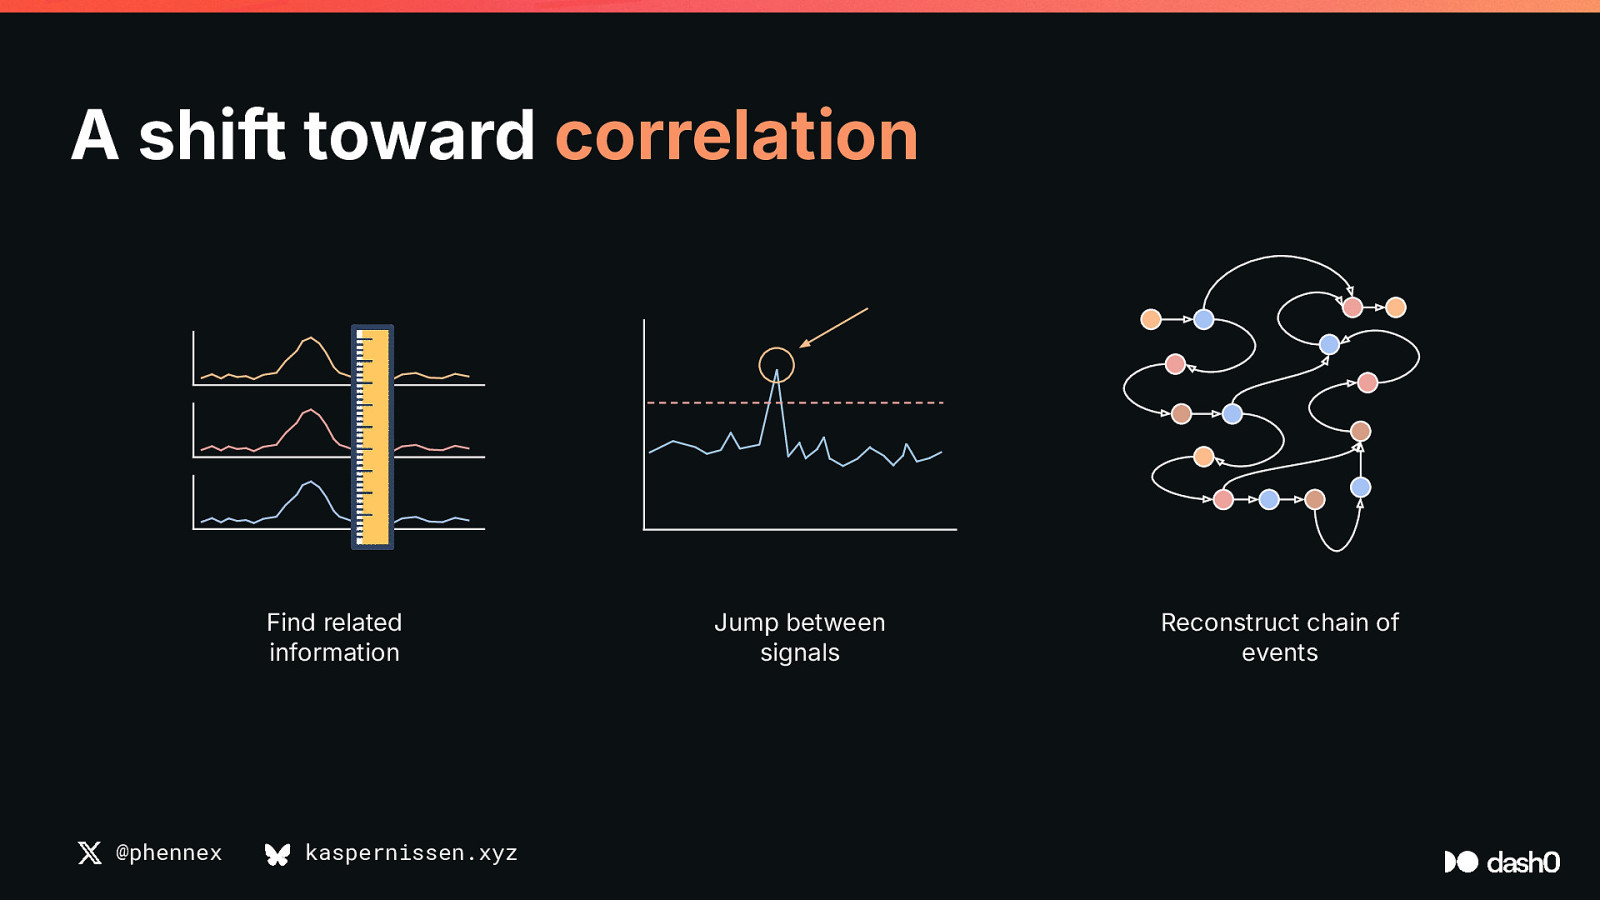
A shift toward correlation Find related information @phennex kaspernissen.xyz Jump between signals Reconstruct chain of events
A shift toward correlation @phennex kaspernissen.xyz
A shift toward… @phennex kaspernissen.xyz
OpenTelemetry OpenTelemetry OTel is an open source project designed to provide standardized tools and APIs for generating, collecting, and exporting telemetry data such as traces, metrics, and logs The de-facto standard for distributed tracing, also supports metrics and logs (soon profiling) The main goals of the project are: ● ● ● Unified telemetry Vendor-neutrality Cross-platform @phennex kaspernissen.xyz
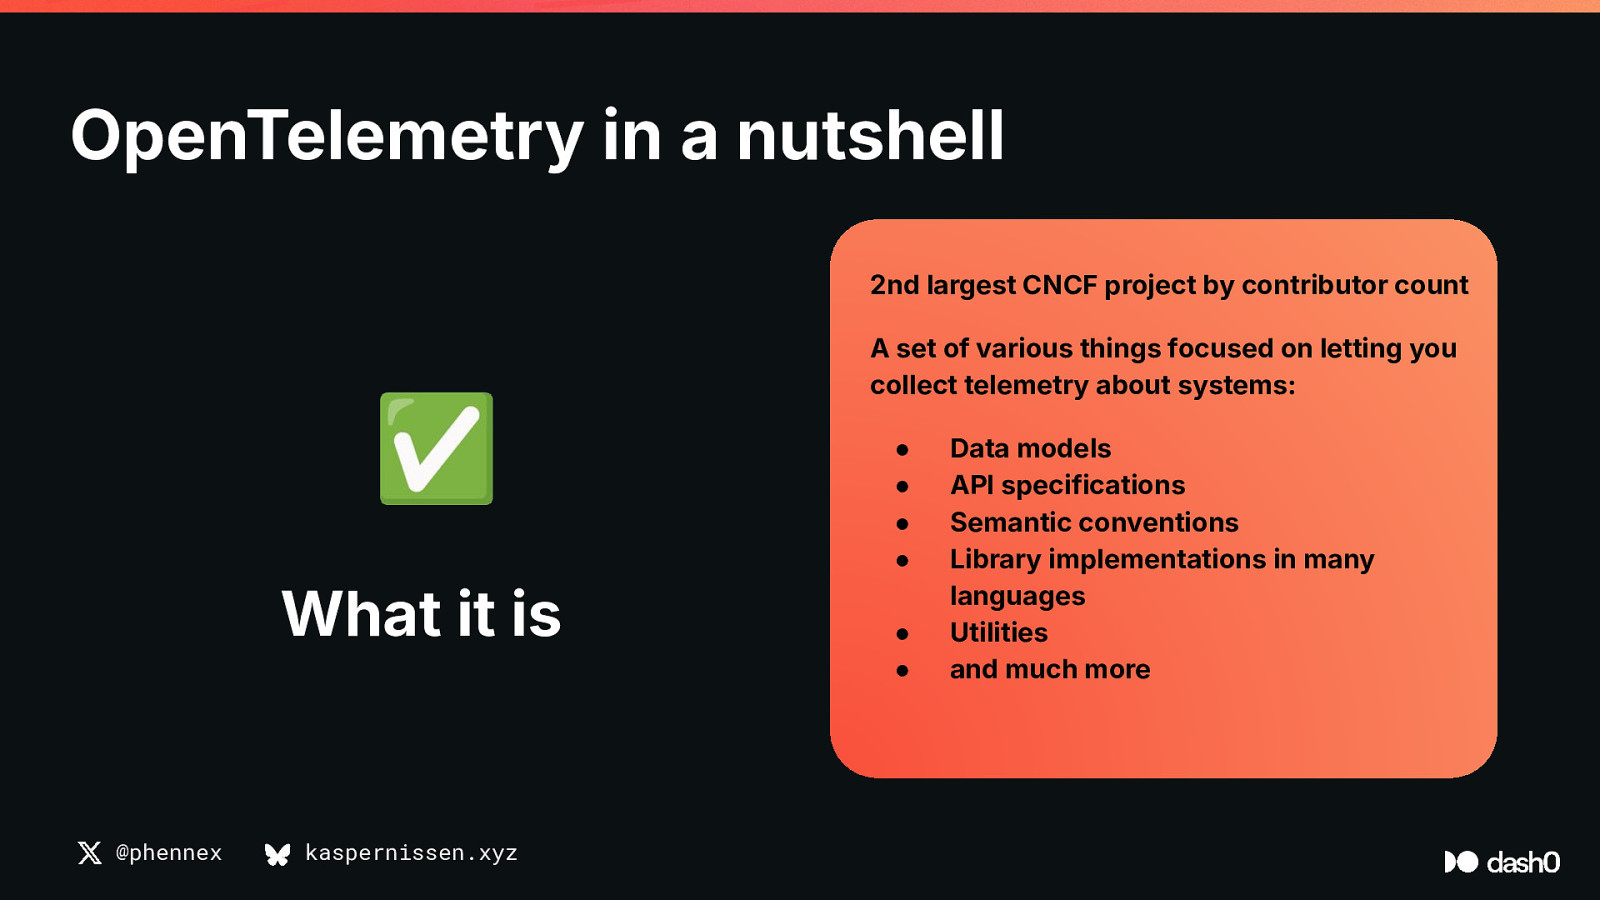
OpenTelemetry in a nutshell 2nd largest CNCF project by contributor count ✅ What it is @phennex kaspernissen.xyz A set of various things focused on letting you collect telemetry about systems: ● ● ● ● ● ● Data models API specifications Semantic conventions Library implementations in many languages Utilities and much more
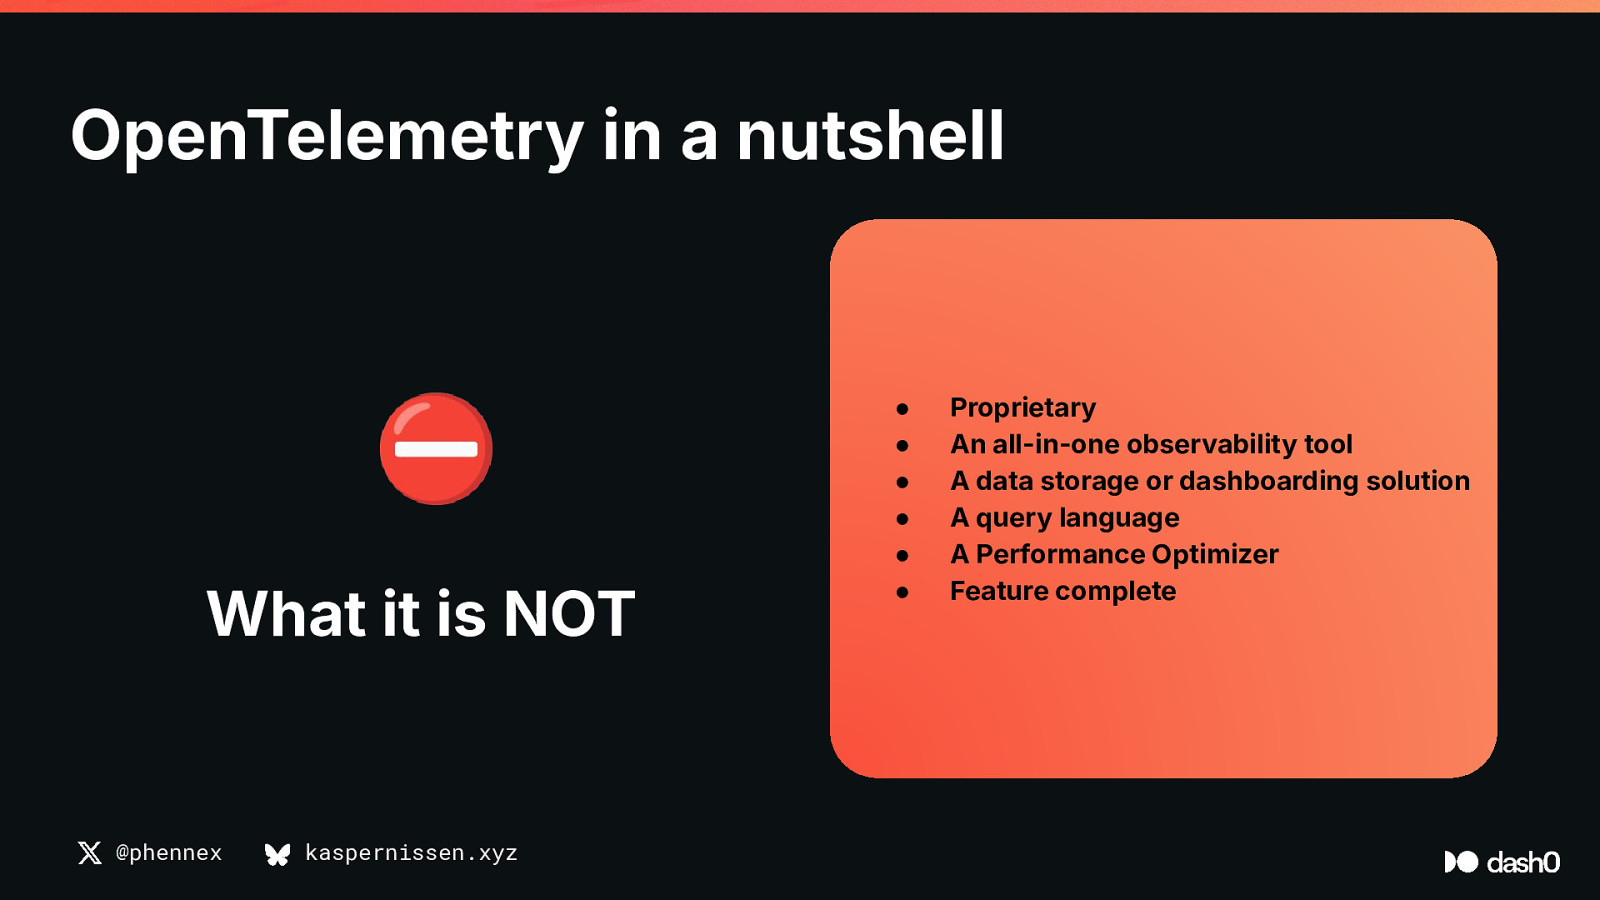
OpenTelemetry in a nutshell ⛔ What it is NOT @phennex kaspernissen.xyz ● ● ● ● ● ● Proprietary An all-in-one observability tool A data storage or dashboarding solution A query language A Performance Optimizer Feature complete
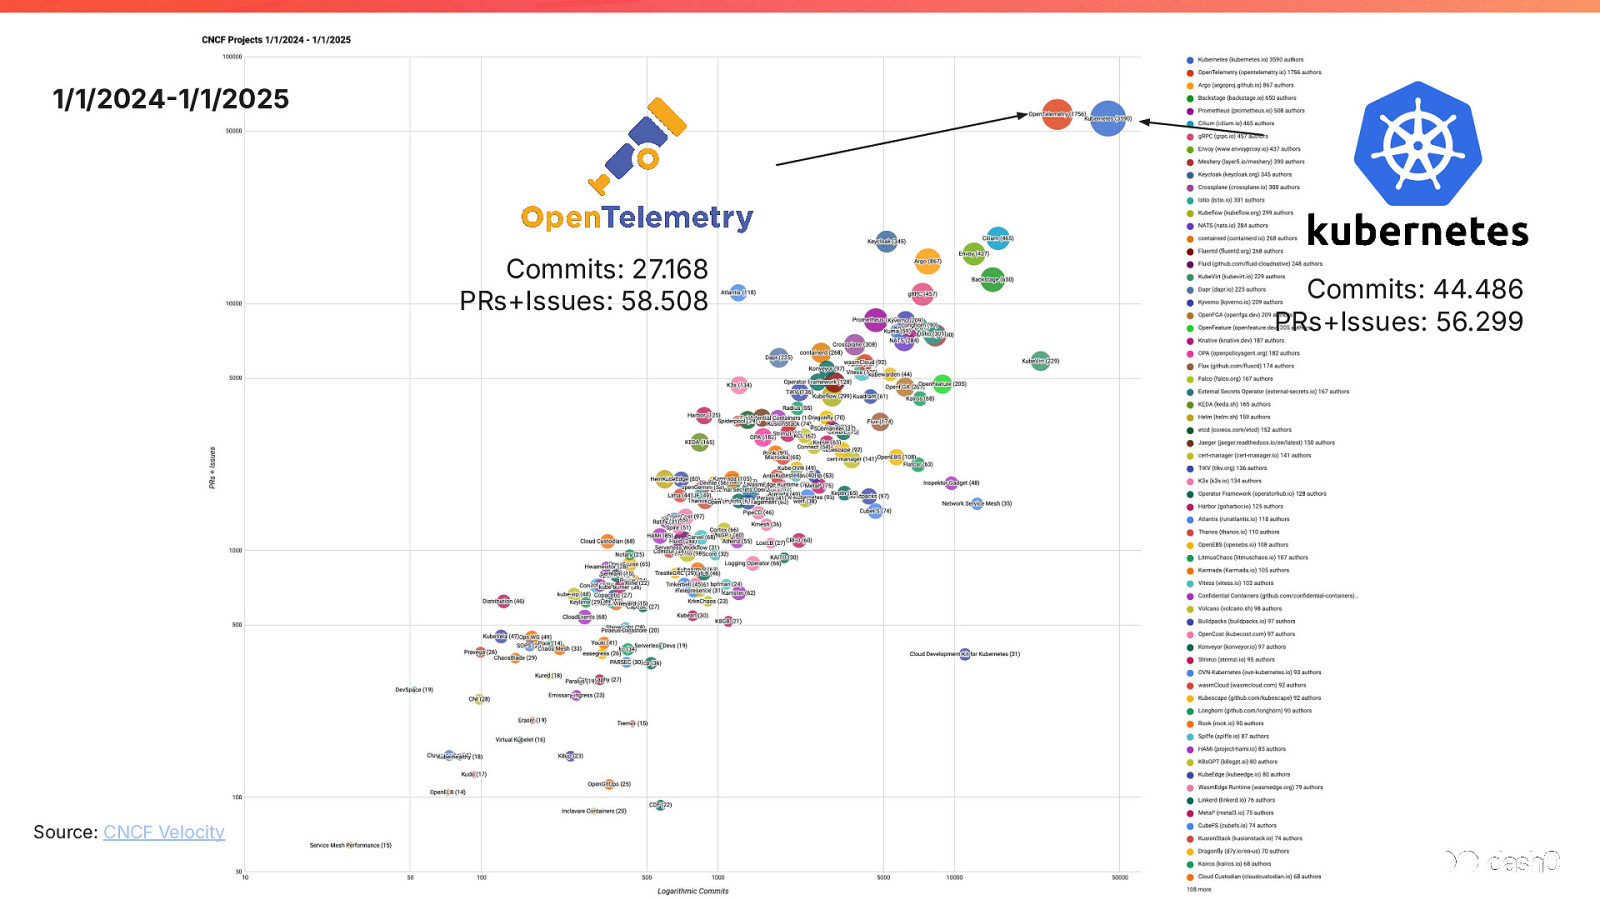
1/1/20241/1/2025 Commits: 27.168 PRs+Issues: 58.508 Source: CNCF Velocity Commits: 44.486 PRs+Issues: 56.299
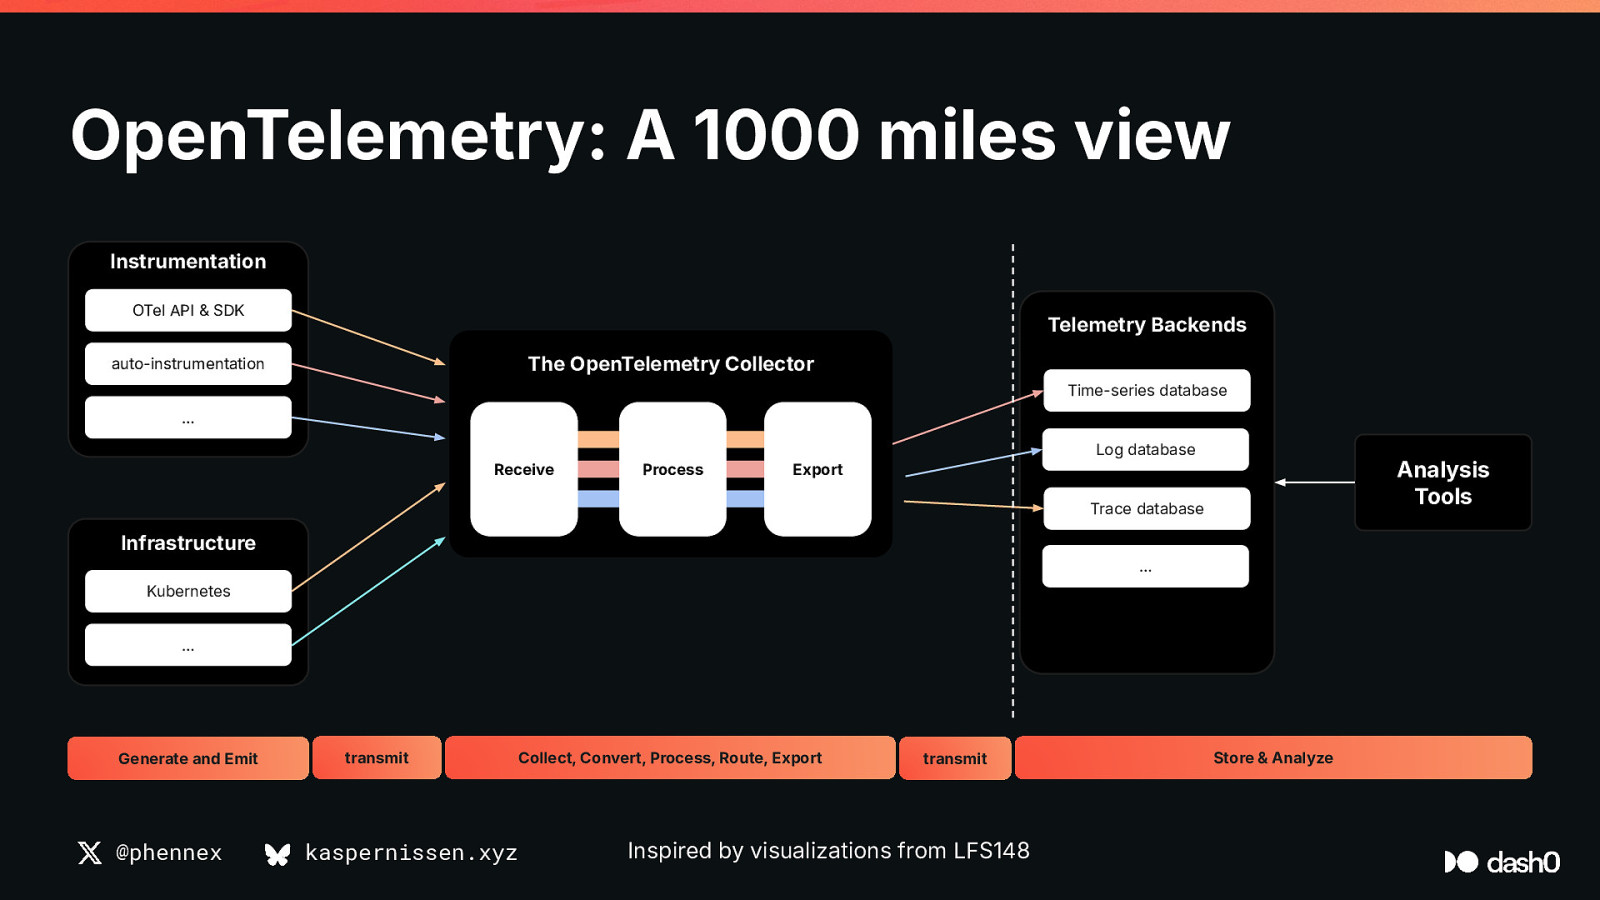
OpenTelemetry: A 1000 miles view Instrumentation OTel API & SDK Telemetry Backends The OpenTelemetry Collector auto-instrumentation Time-series database … Log database Receive Process Analysis Tools Export Trace database Infrastructure … Kubernetes … Generate and Emit @phennex transmit kaspernissen.xyz Collect, Convert, Process, Route, Export transmit Inspired by visualizations from LFS148 Store & Analyze
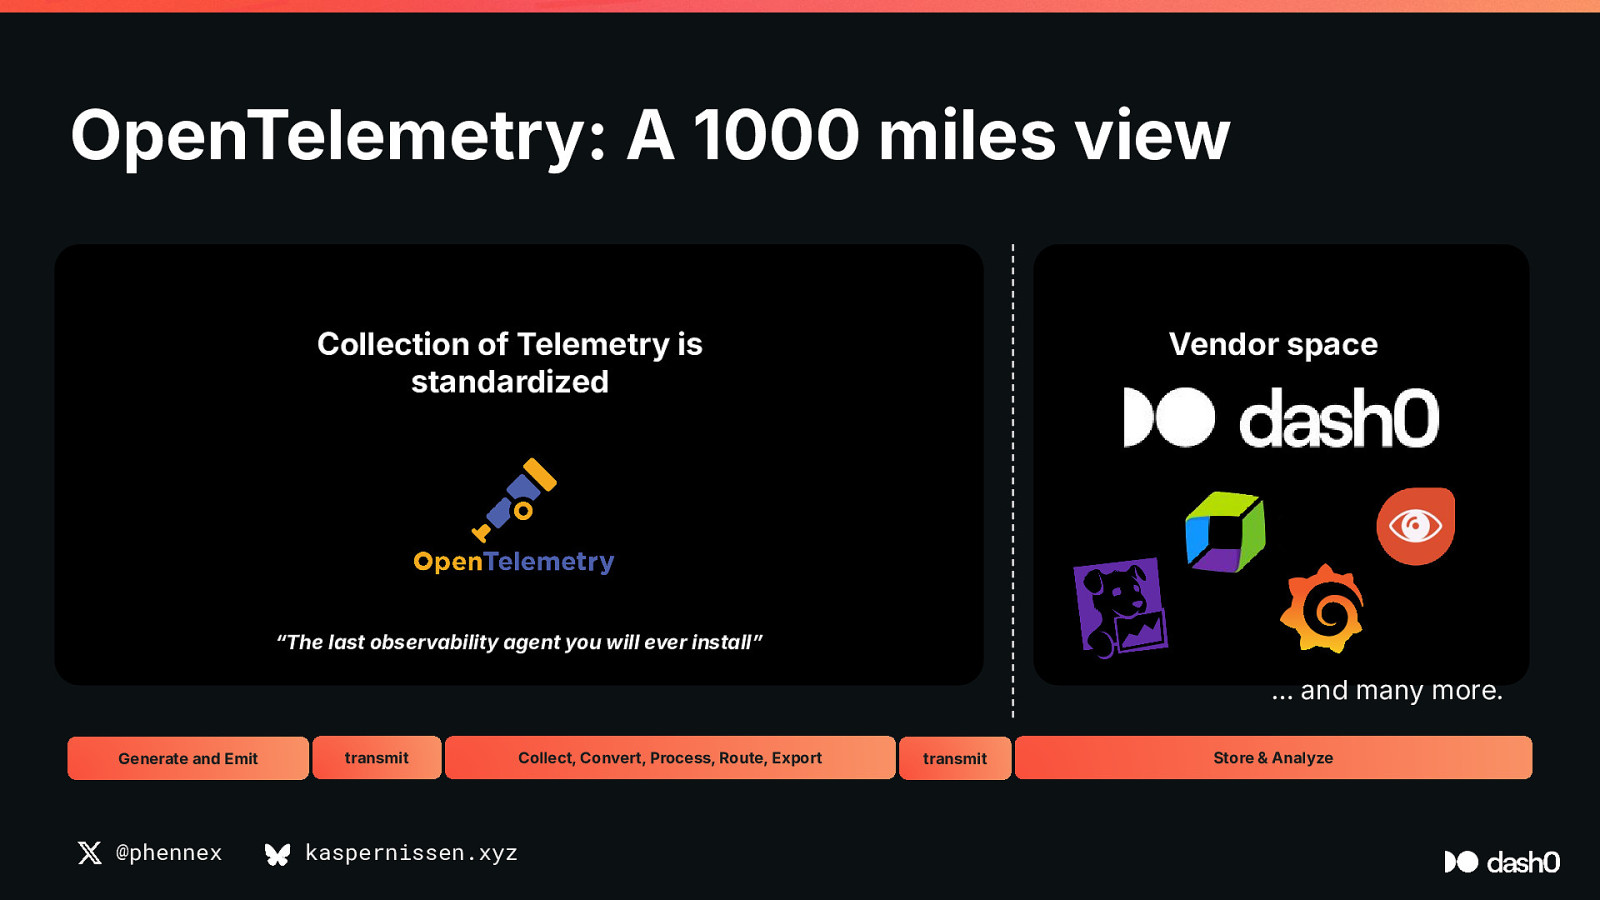
OpenTelemetry: A 1000 miles view OTel API & SDK auto-instrumentation Vendor space Collection of Telemetry is The OpenTelemetry Collector standardized … Receive Process Export Infrastructure Kubernetes … “The last observability agent you will ever installˮ … and many more. Generate and Emit @phennex transmit kaspernissen.xyz Collect, Convert, Process, Route, Export transmit Store & Analyze
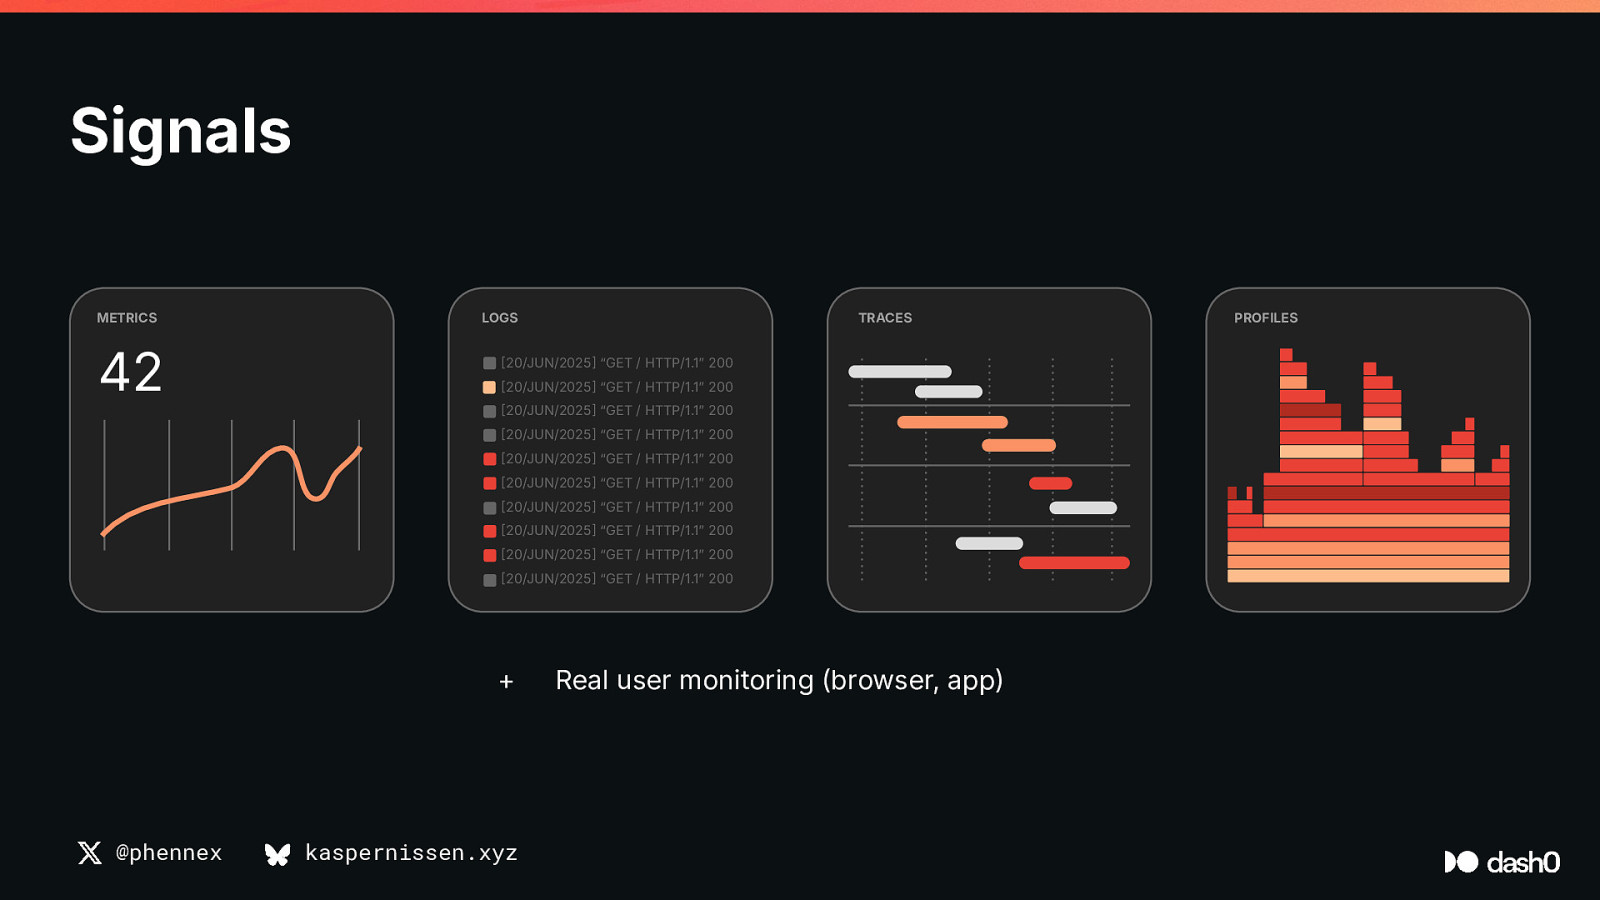
Signals METRICS 42 LOGS TRACES 20/JUN/2025 “GET / HTTP/1.1ˮ 200 20/JUN/2025 “GET / HTTP/1.1ˮ 200 20/JUN/2025 “GET / HTTP/1.1ˮ 200 20/JUN/2025 “GET / HTTP/1.1ˮ 200 20/JUN/2025 “GET / HTTP/1.1ˮ 200 20/JUN/2025 “GET / HTTP/1.1ˮ 200 20/JUN/2025 “GET / HTTP/1.1ˮ 200 20/JUN/2025 “GET / HTTP/1.1ˮ 200 20/JUN/2025 “GET / HTTP/1.1ˮ 200 20/JUN/2025 “GET / HTTP/1.1ˮ 200 + @phennex kaspernissen.xyz Real user monitoring (browser, app) PROFILES
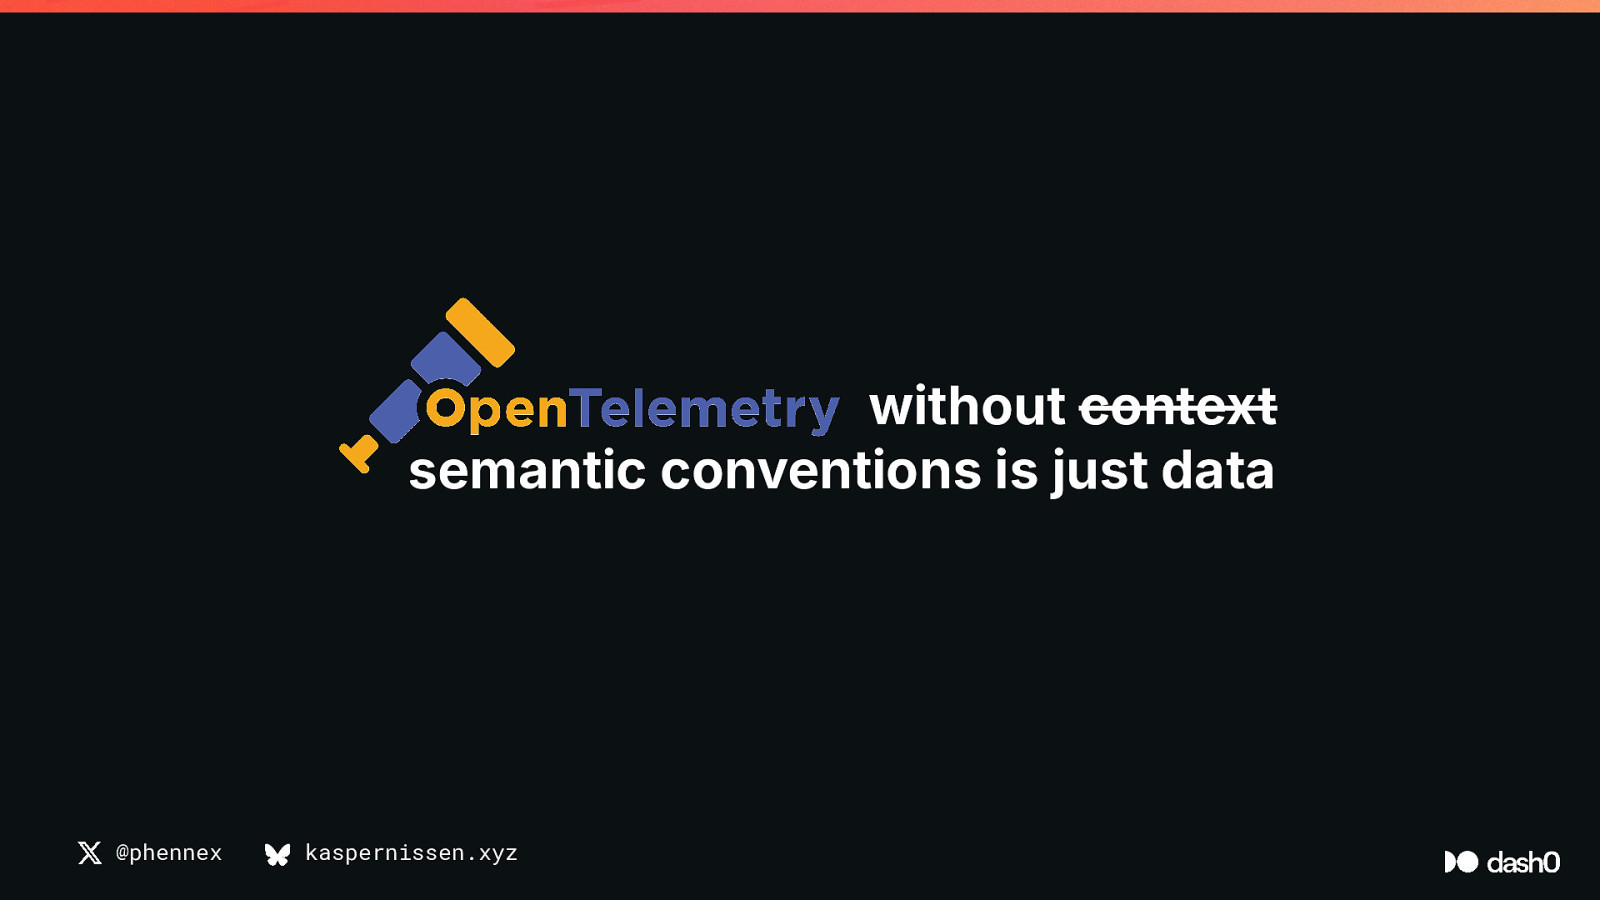
Telemetry without context is just data @phennex kaspernissen.xyz
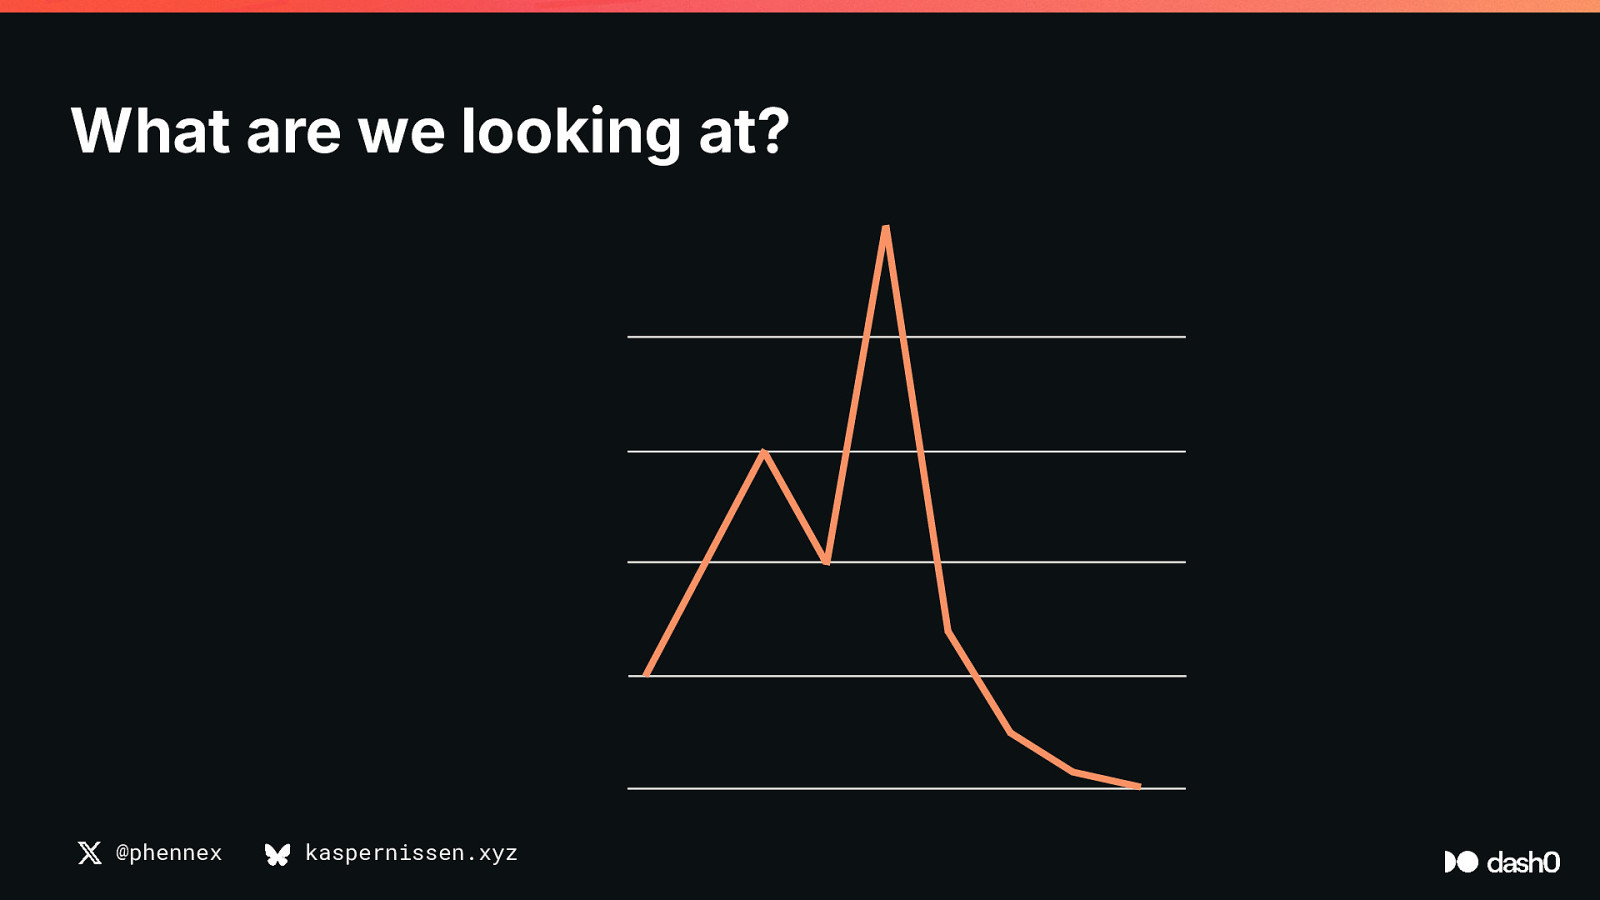
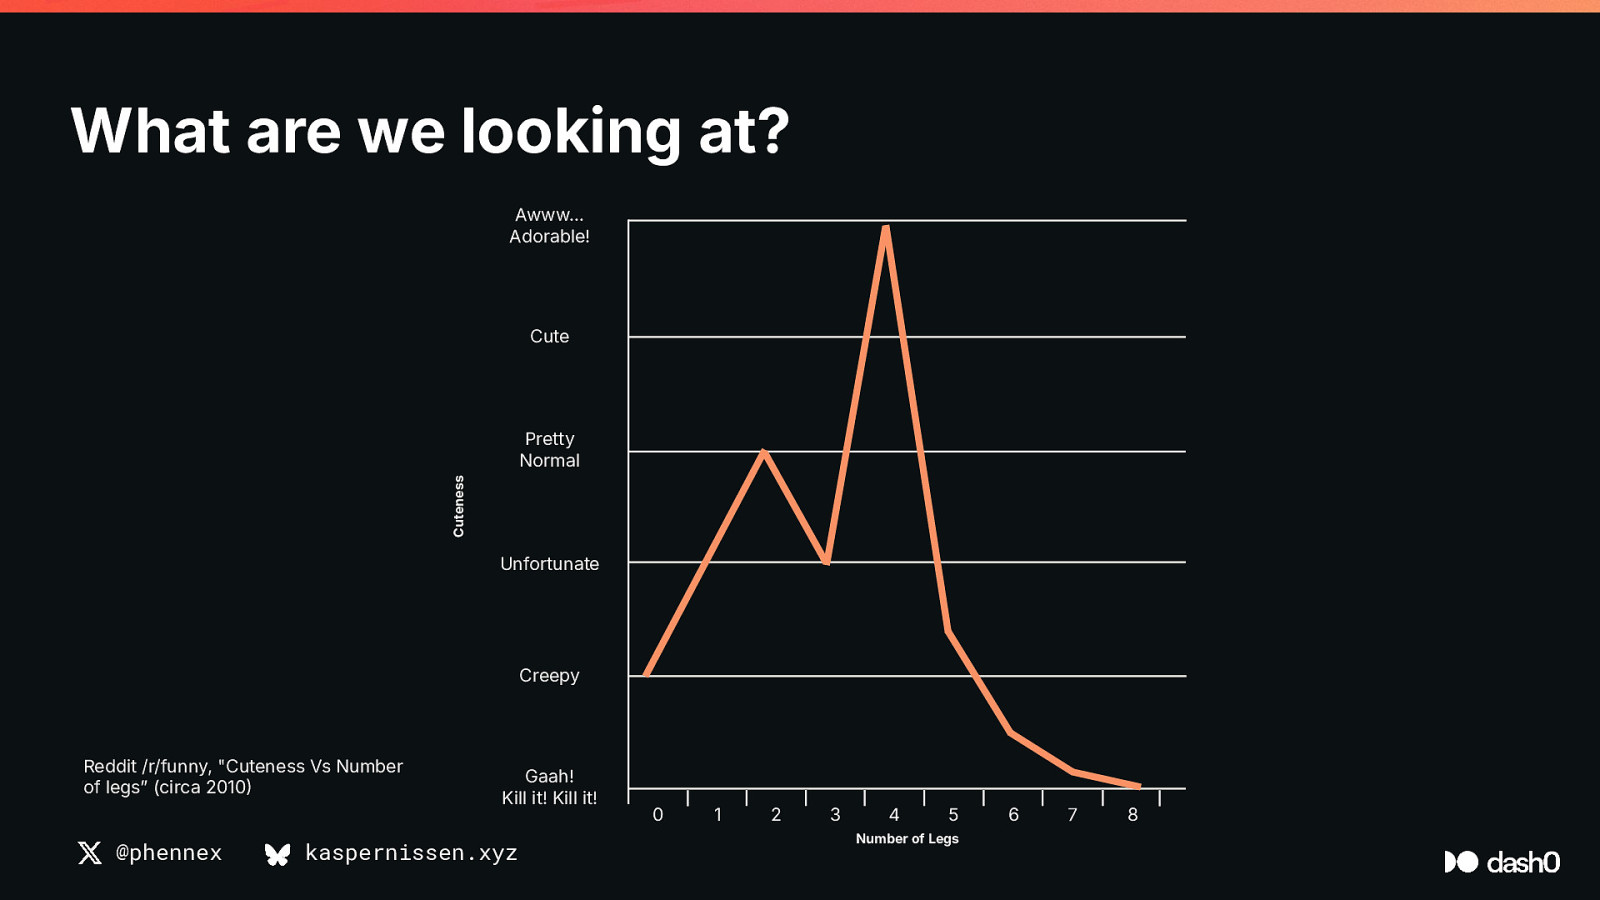
What are we looking at? @phennex kaspernissen.xyz
What are we looking at? Awww… Adorable! Cute Cuteness Pretty Normal Unfortunate Creepy Reddit /r/funny, “Cuteness Vs Number of legsˮ (circa 2010 @phennex Gaah! Kill it! Kill it! kaspernissen.xyz 0 1 2 3 4 5 Number of Legs 6 7 8
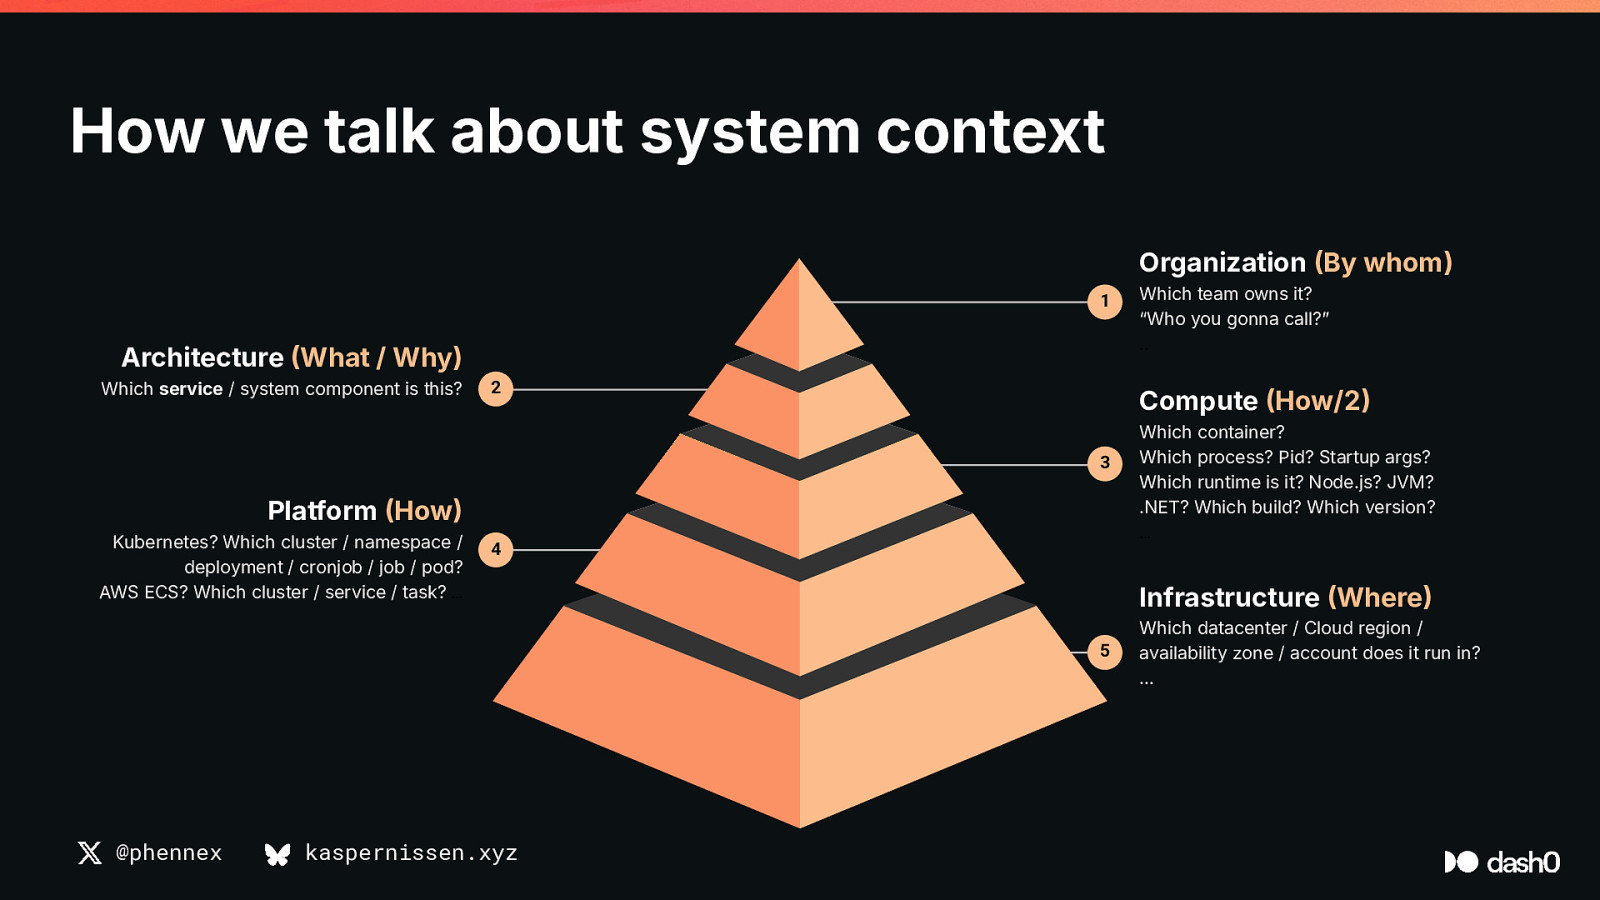
How we talk about system context Organization By whom) 1 Architecture What / Why) Which service / system component is this? 2 Compute How/2 3 Platform How Kubernetes? Which cluster / namespace / deployment / cronjob / job / pod? AWS ECS? Which cluster / service / task? … 4 kaspernissen.xyz Which container? Which process? Pid? Startup args? Which runtime is it? Node.js? JVM? .NET? Which build? Which version? … Infrastructure Where 5 @phennex Which team owns it? “Who you gonna call?ˮ .. Which datacenter / Cloud region / availability zone / account does it run in? …
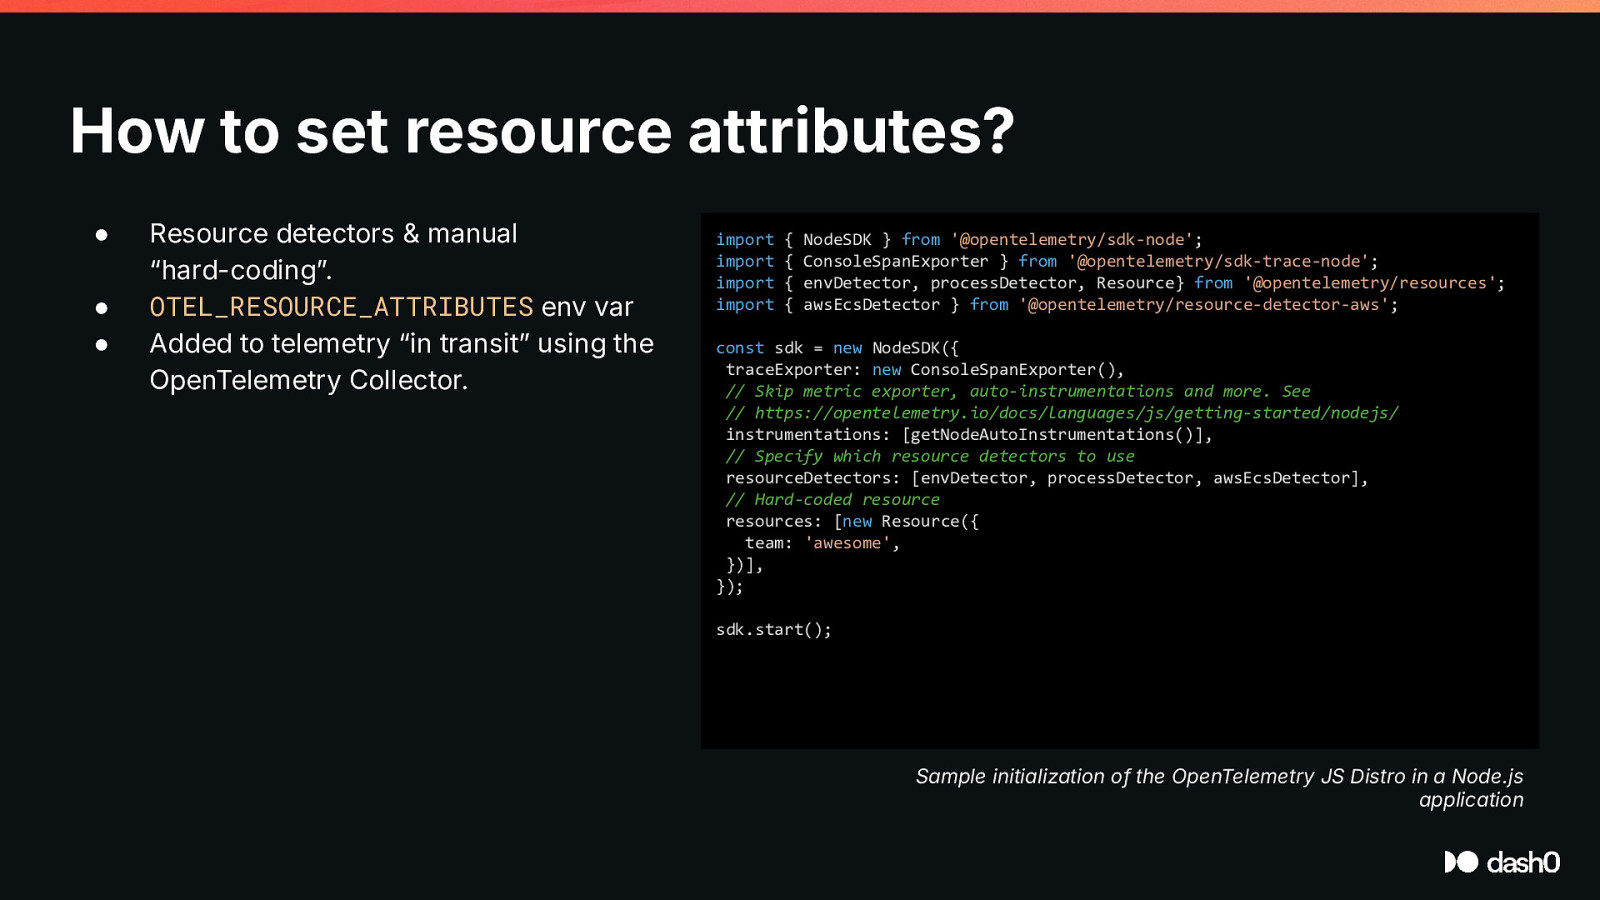
How to set resource attributes? ● ● ● Resource detectors & manual “hard-codingˮ. OTEL_RESOURCE_ATTRIBUTES env var Added to telemetry “in transitˮ using the OpenTelemetry Collector. import import import import { { { { NodeSDK } from ‘@opentelemetry/sdk-node’; ConsoleSpanExporter } from ‘@opentelemetry/sdk-trace-node’; envDetector, processDetector, Resource} from ‘@opentelemetry/resources’; awsEcsDetector } from ‘@opentelemetry/resource-detector-aws’; const sdk = new NodeSDK({ traceExporter: new ConsoleSpanExporter(), // Skip metric exporter, auto-instrumentations and more. See // https://opentelemetry.io/docs/languages/js/getting-started/nodejs/ instrumentations: [getNodeAutoInstrumentations()], // Specify which resource detectors to use resourceDetectors: [envDetector, processDetector, awsEcsDetector], // Hard-coded resource resources: [new Resource({ team: ‘awesome’, })], }); sdk.start(); Sample initialization of the OpenTelemetry JS Distro in a Node.js application
without context semantic conventions is just data @phennex kaspernissen.xyz
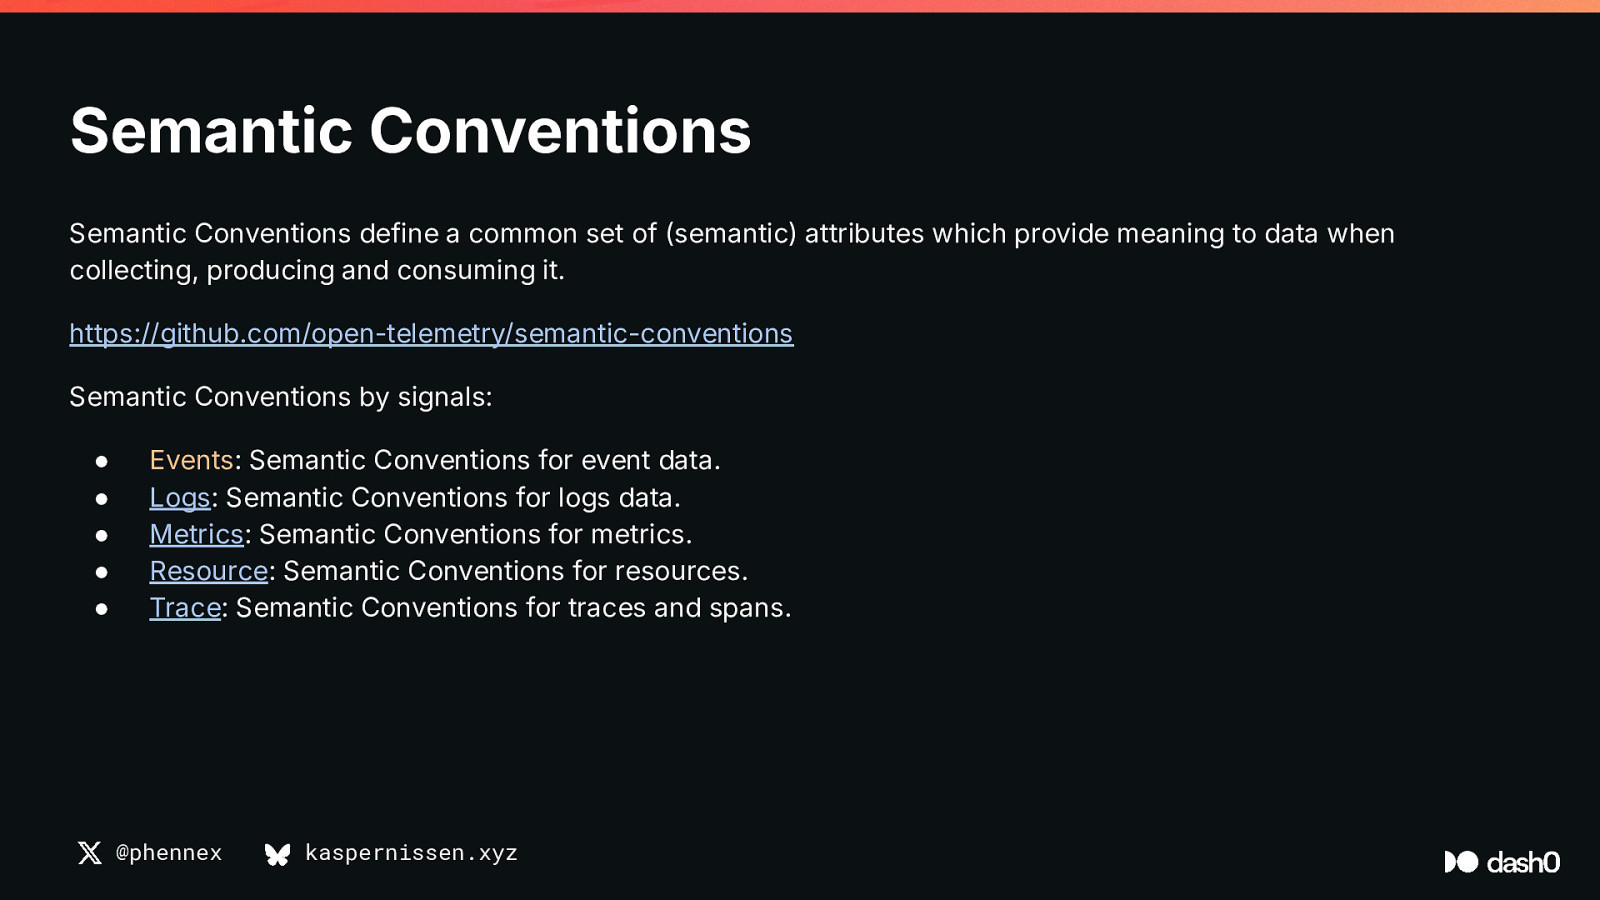
Semantic Conventions Semantic Conventions define a common set of (semantic) attributes which provide meaning to data when collecting, producing and consuming it. https://github.com/open-telemetry/semantic-conventions Semantic Conventions by signals: ● ● ● ● ● Events: Semantic Conventions for event data. Logs: Semantic Conventions for logs data. Metrics: Semantic Conventions for metrics. Resource: Semantic Conventions for resources. Trace: Semantic Conventions for traces and spans. @phennex kaspernissen.xyz
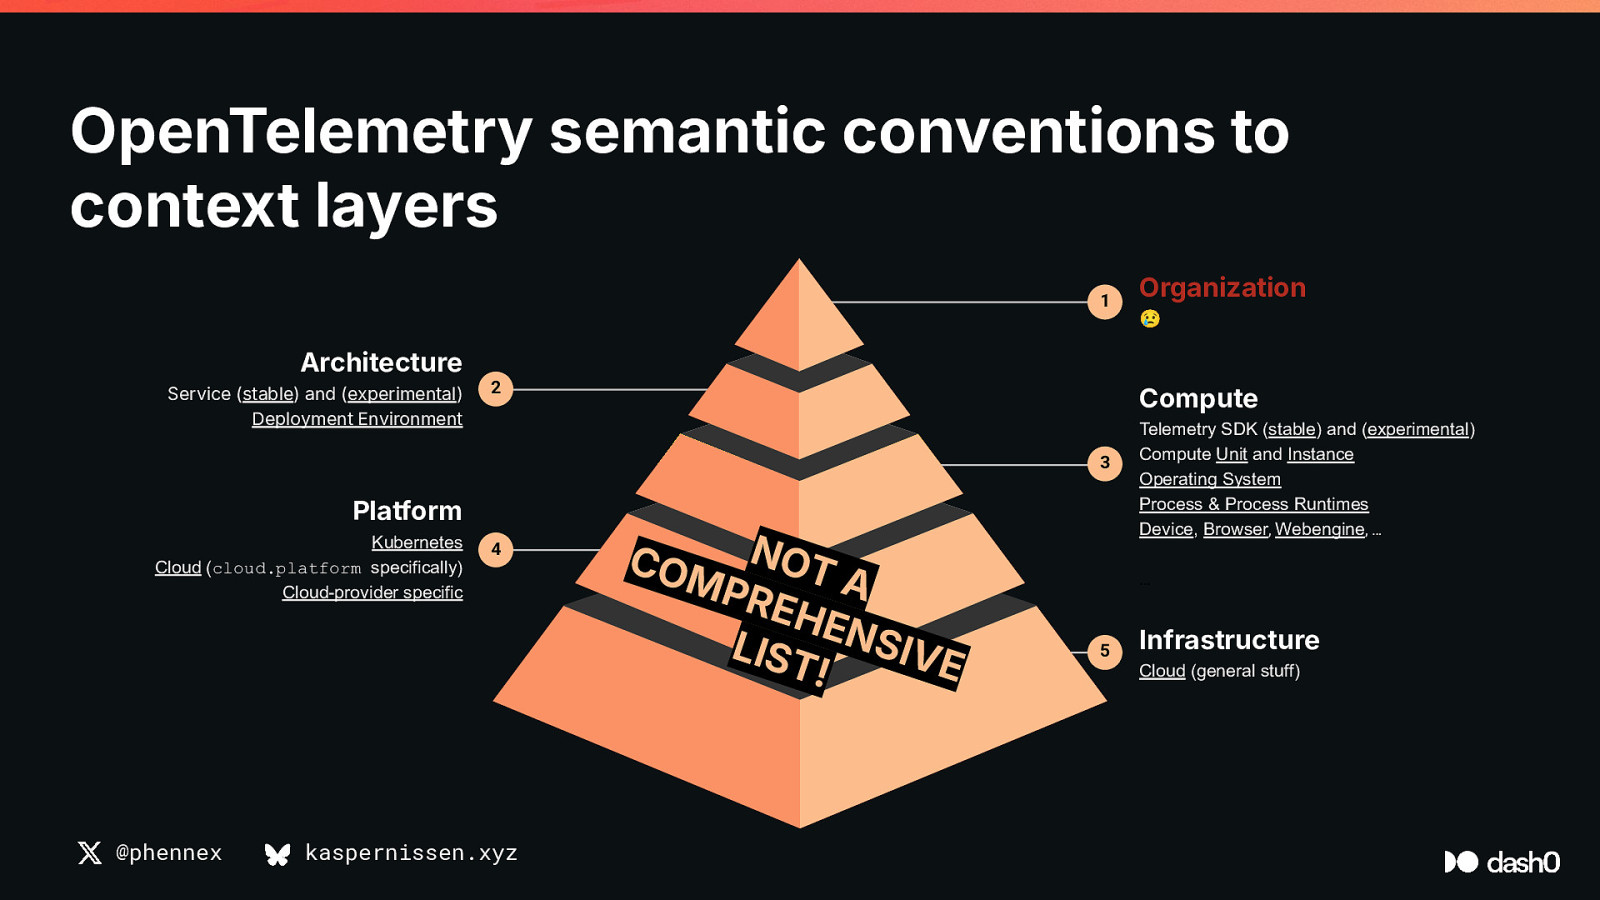
OpenTelemetry semantic conventions to context layers 1 Organization 😢 Architecture Service (stable) and (experimental) Deployment Environment 2 Compute 3 Platform Kubernetes Cloud (cloud.platform specifically) Cloud-provider specific @phennex 4 kaspernissen.xyz COM NOT PRE A HE LIST NSIVE ! Telemetry SDK (stable) and (experimental) Compute Unit and Instance Operating System Process & Process Runtimes Device, Browser, Webengine, … … 5 Infrastructure Cloud (general stuff)
So, why OpenTelemetry? Instrument once, use everywhere @phennex Separate telemetry generation from analysis kaspernissen.xyz Make software observable by default Improve how we use telemetry
Thatʼs all great, but how do I make it easily accessible for my developers? @phennex kaspernissen.xyz
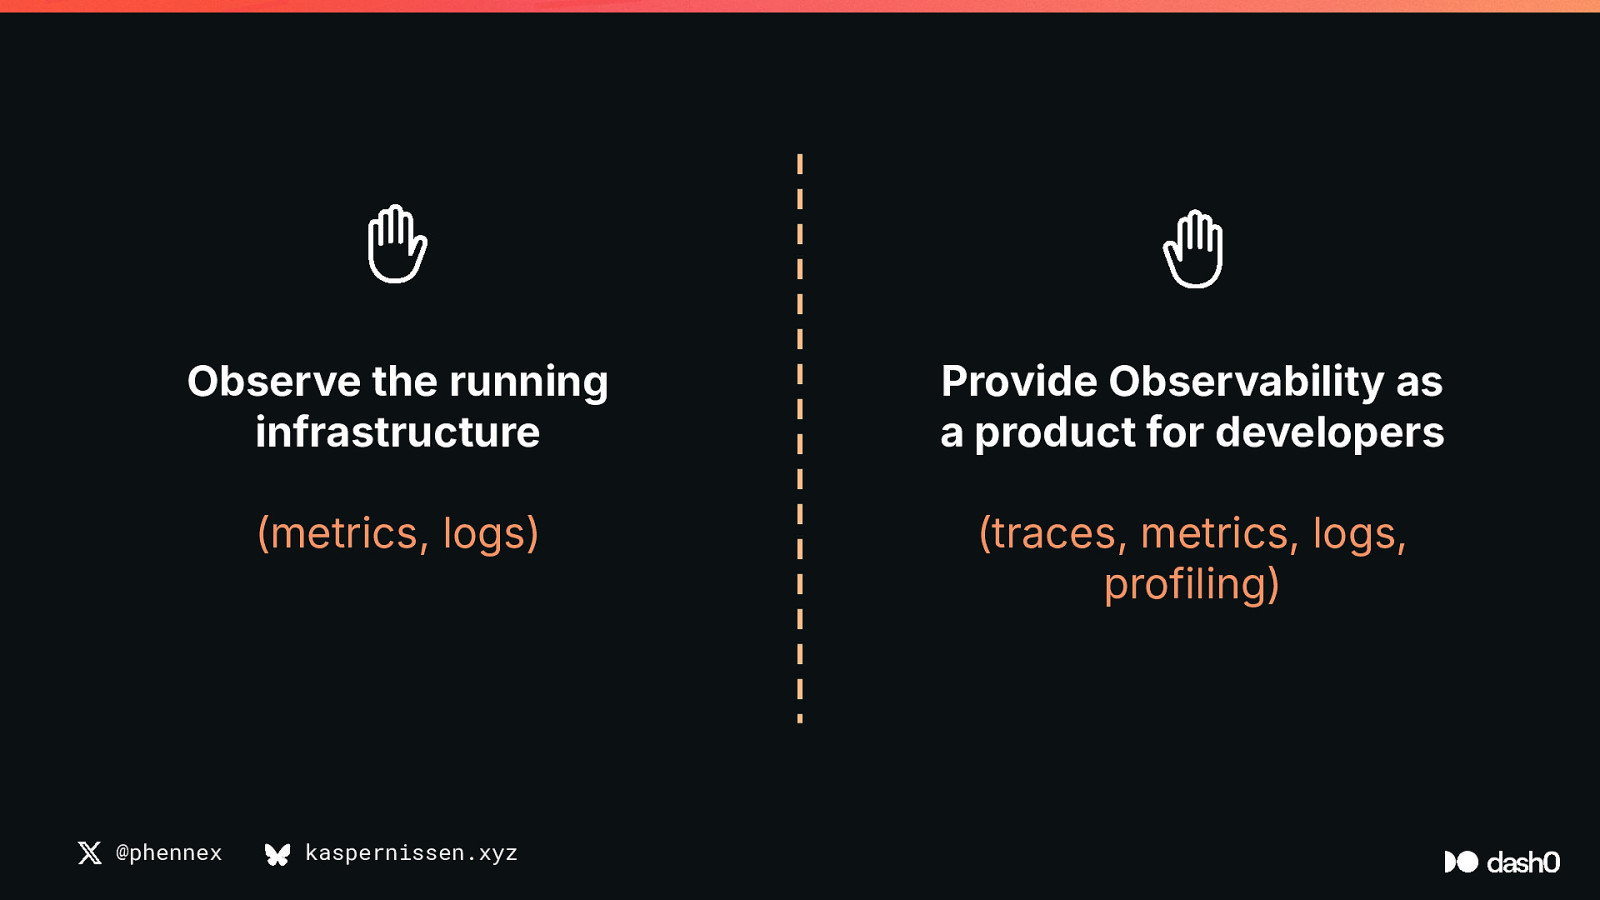
The dual role of Platform Engineers in Observability @phennex kaspernissen.xyz
Observe the running infrastructure Provide Observability as a product for developers (metrics, logs) (traces, metrics, logs, profiling) @phennex kaspernissen.xyz
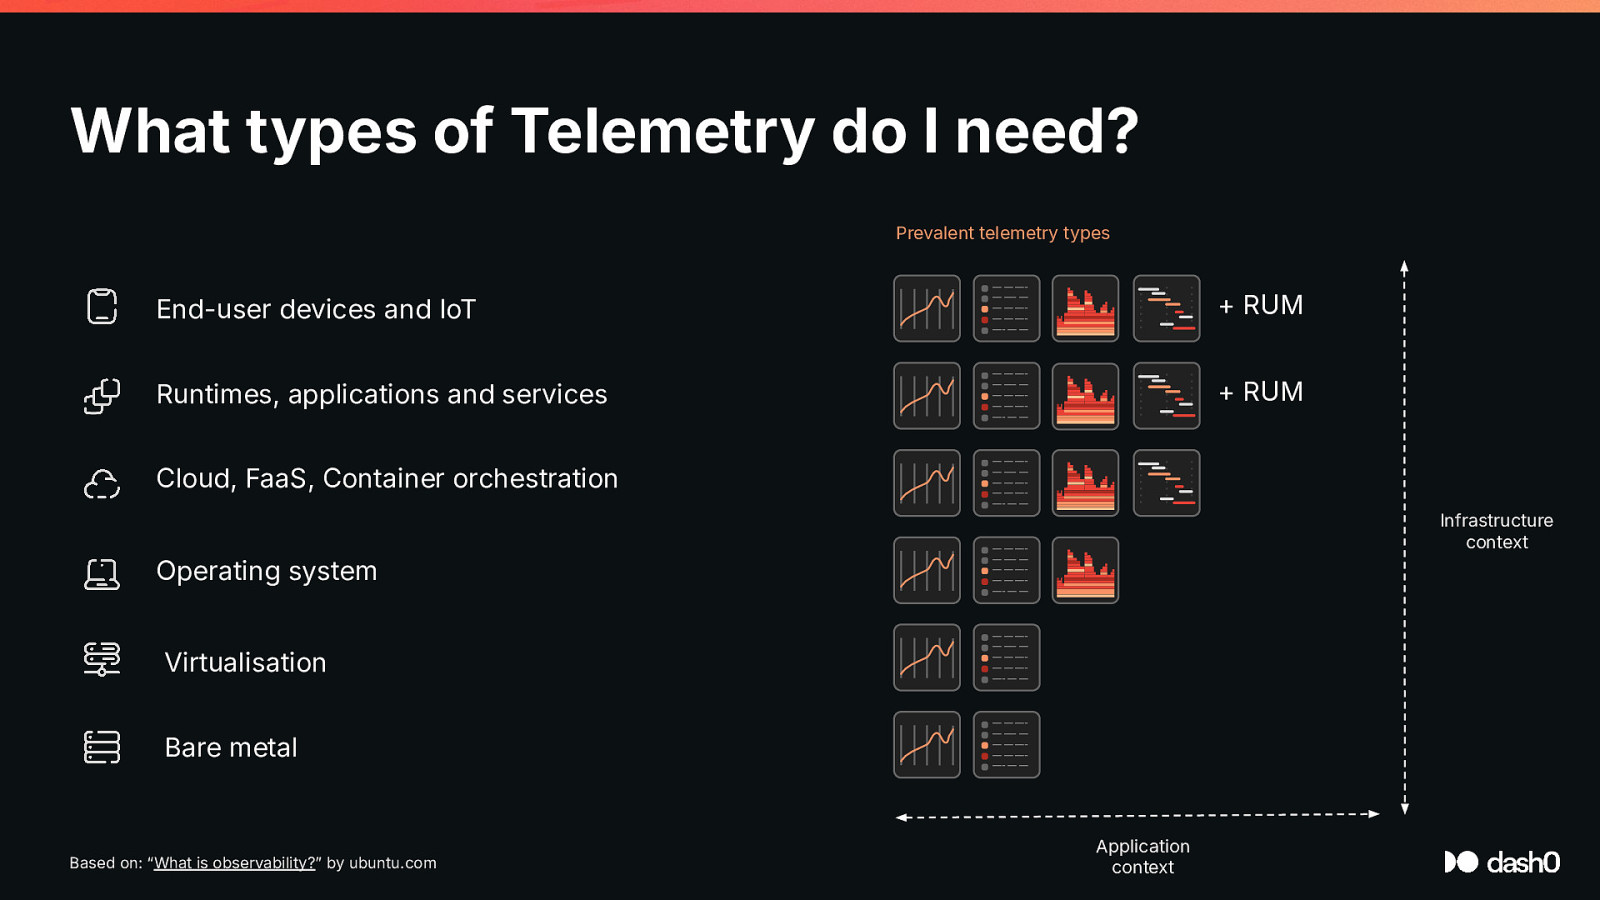
What types of Telemetry do I need? Prevalent telemetry types End-user devices and IoT — — —— —- — — — —— — ——- — —
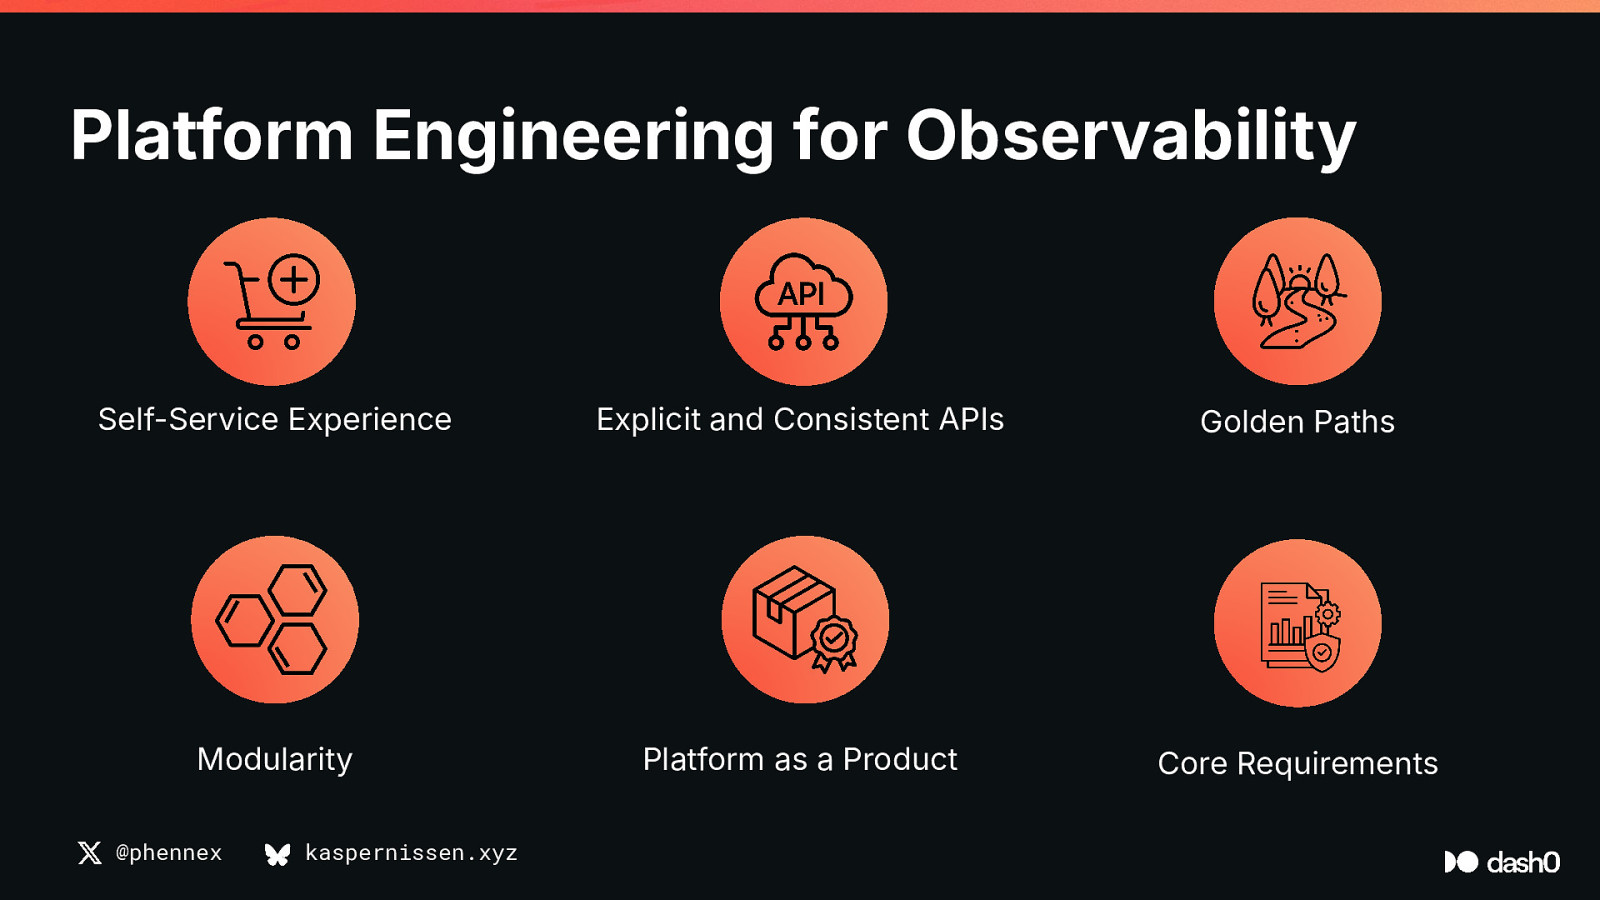
Platform Engineering for Observability Self-Service Experience Explicit and Consistent APIs Golden Paths Modularity Platform as a Product Core Requirements @phennex kaspernissen.xyz
Platform Engineering for Observability Self-Service Experience Auto-Instrumentation Explicit and Consistent APIs Semantic Conventions Golden Paths Observability built-in Modularity Collector Pipelines Platform as a Product Documentation + Support Core Requirements Cross-signal correlation @phennex kaspernissen.xyz
Thatʼs all great, but I ask again, how do I make it easily accessible for my developers? @phennex kaspernissen.xyz
The answer: Auto-instrumentation + Operators = No-touch Instrumentation @phennex kaspernissen.xyz
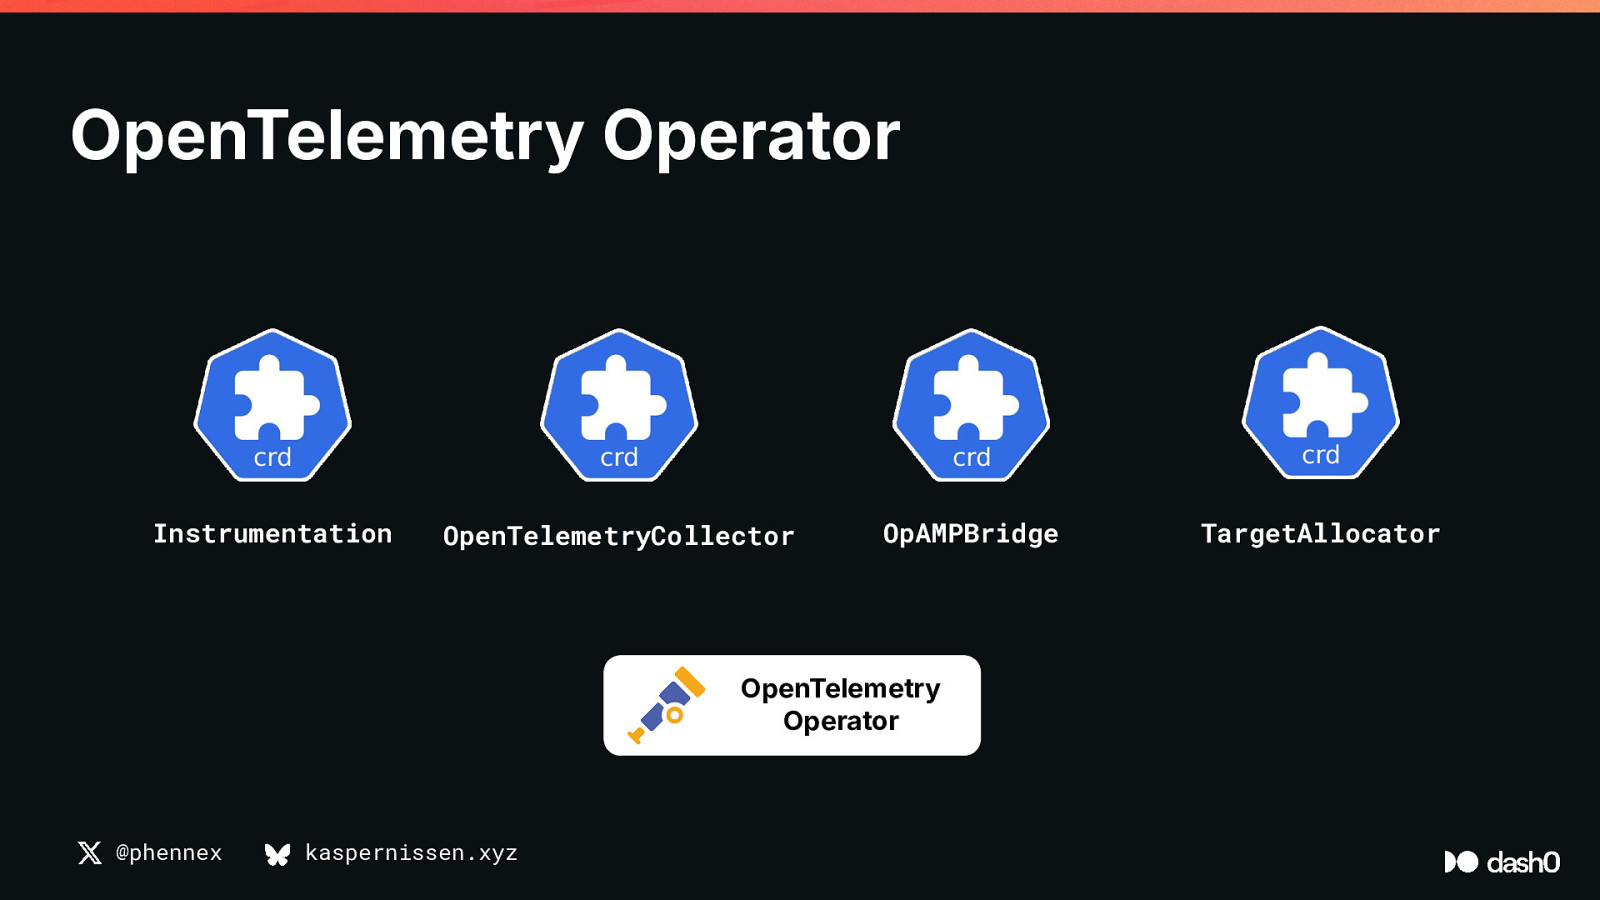
OpenTelemetry Operator Instrumentation OpenTelemetryCollector OpAMPBridge OpenTelemetry Operator @phennex kaspernissen.xyz TargetAllocator
Auto-Instrumentation with the OpenTelemetry Operator Instrumentation Instructs how to inject auto-instrumentation Injects instrumentation in to the pod OpenTelemetry Operator @phennex kaspernissen.xyz
Observability doesnʼt stop at instrumentation. @phennex kaspernissen.xyz
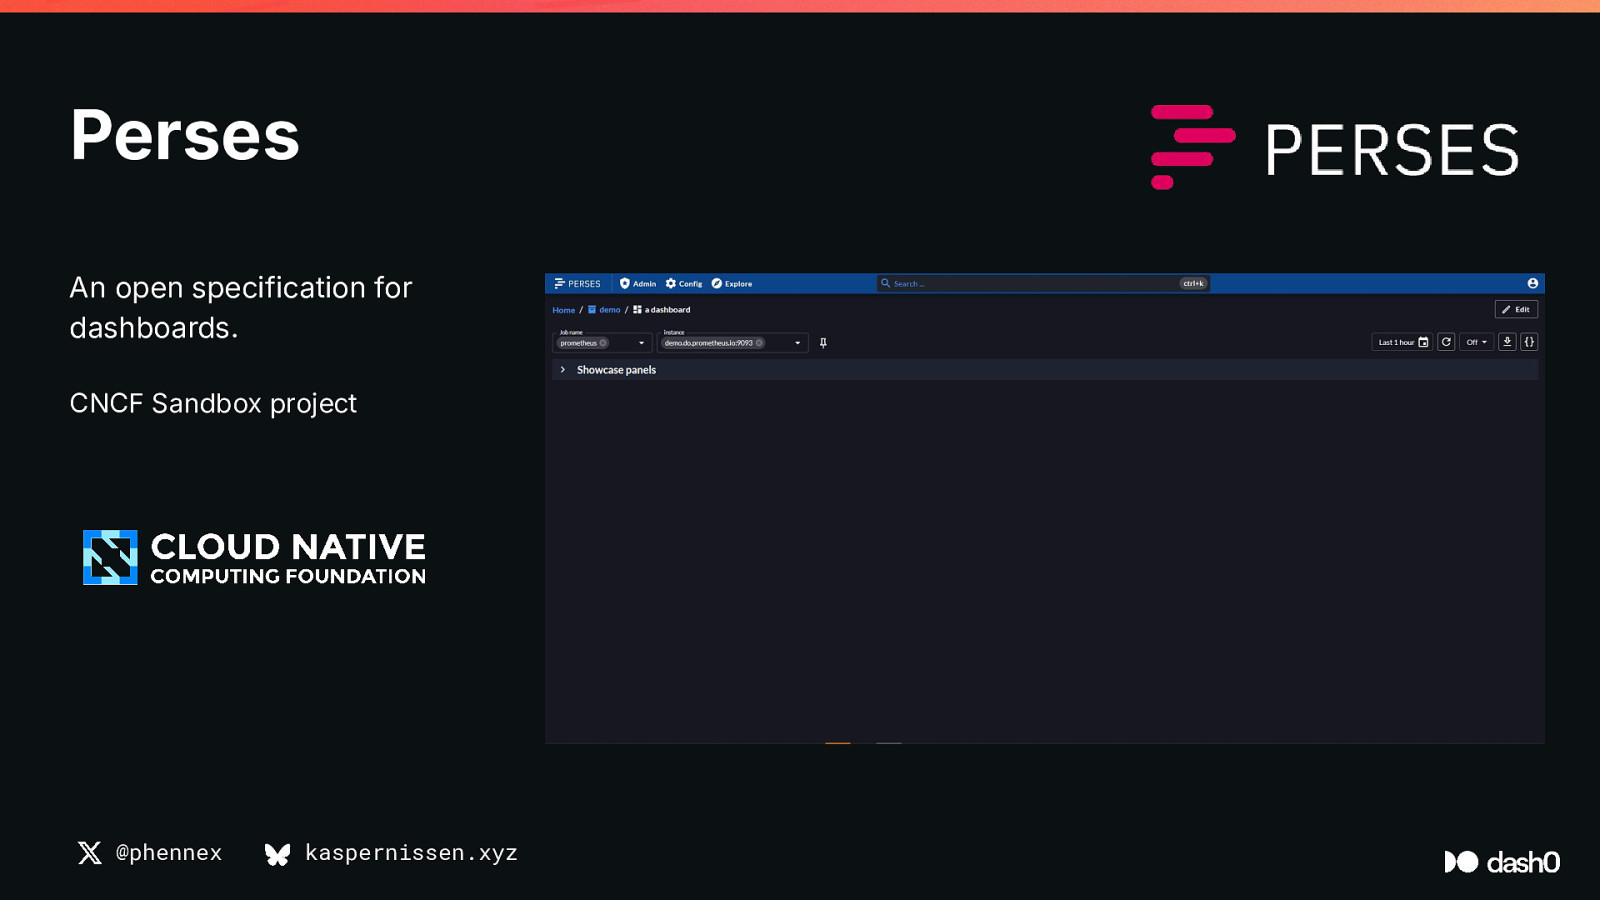
Perses An open specification for dashboards. CNCF Sandbox project @phennex kaspernissen.xyz
Dashboards as Code Perses PersesDatasource perses-operator @phennex kaspernissen.xyz PersesDashboard
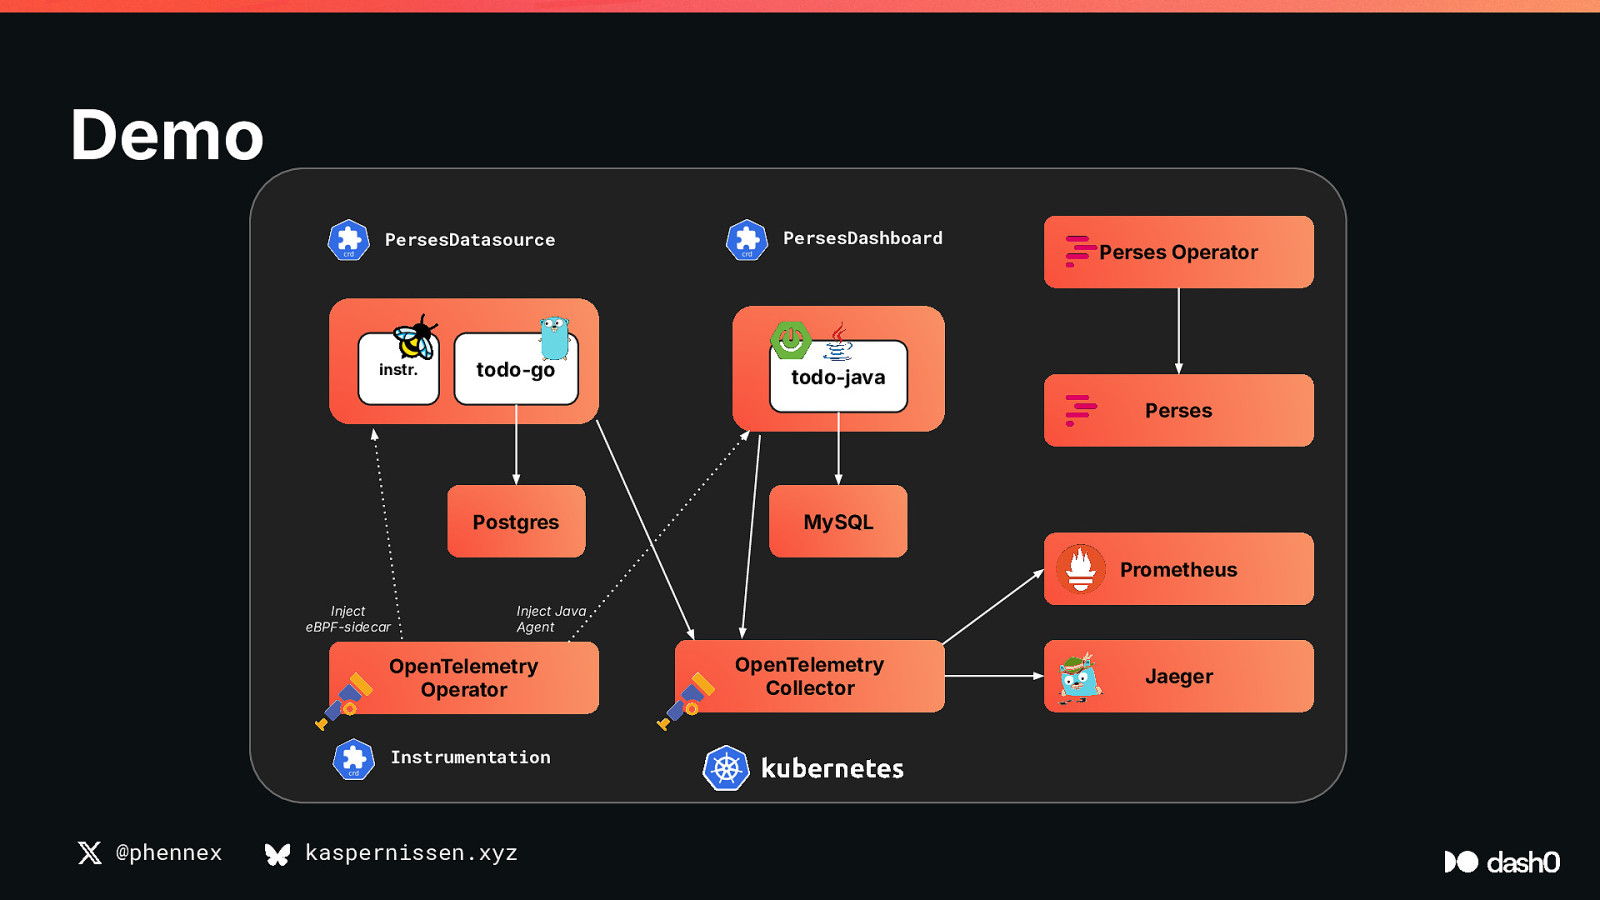
Demo PersesDatasource instr. todo-go PersesDashboard Perses Operator todo-java Perses Postgres MySQL Prometheus Inject eBPF-sidecar Inject Java Agent OpenTelemetry Operator Instrumentation @phennex kaspernissen.xyz OpenTelemetry Collector Jaeger
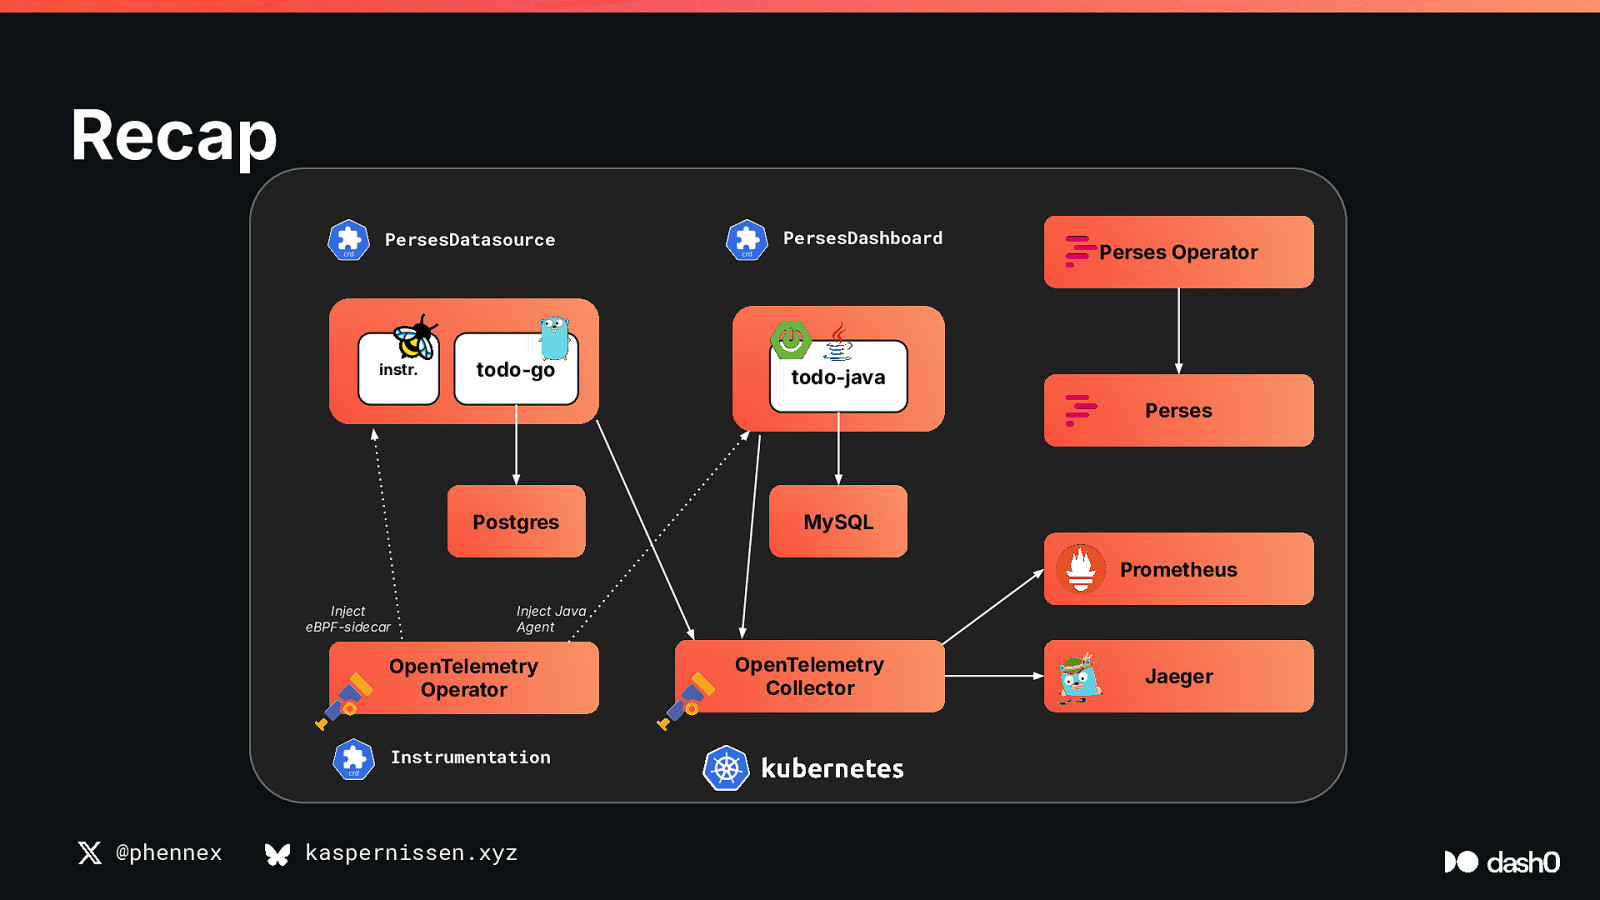
Recap PersesDatasource instr. todo-go PersesDashboard Perses Operator todo-java Perses Postgres MySQL Prometheus Inject eBPF-sidecar Inject Java Agent OpenTelemetry Operator Instrumentation @phennex kaspernissen.xyz OpenTelemetry Collector Jaeger
Observability is evolving - fast. @phennex kaspernissen.xyz
OpenTelemetry is standardizing telemetry collection. @phennex kaspernissen.xyz
Perses is standardizing dashboarding. @phennex kaspernissen.xyz
Applying Platform Engineering principles can transform observability from an afterthought into a seamless, scalable, and developer-friendly experience. @phennex kaspernissen.xyz
Observability is a systems problem - not a tracing, logging, or metrics problem. @phennex kaspernissen.xyz
When we connect signals together, we empower developers to solve problems faster. @phennex kaspernissen.xyz
And last but not least, Building on Open Standards allows you to freely move between vendors, ensuring they stay on their toes and provide you the best possible experience. @phennex kaspernissen.xyz
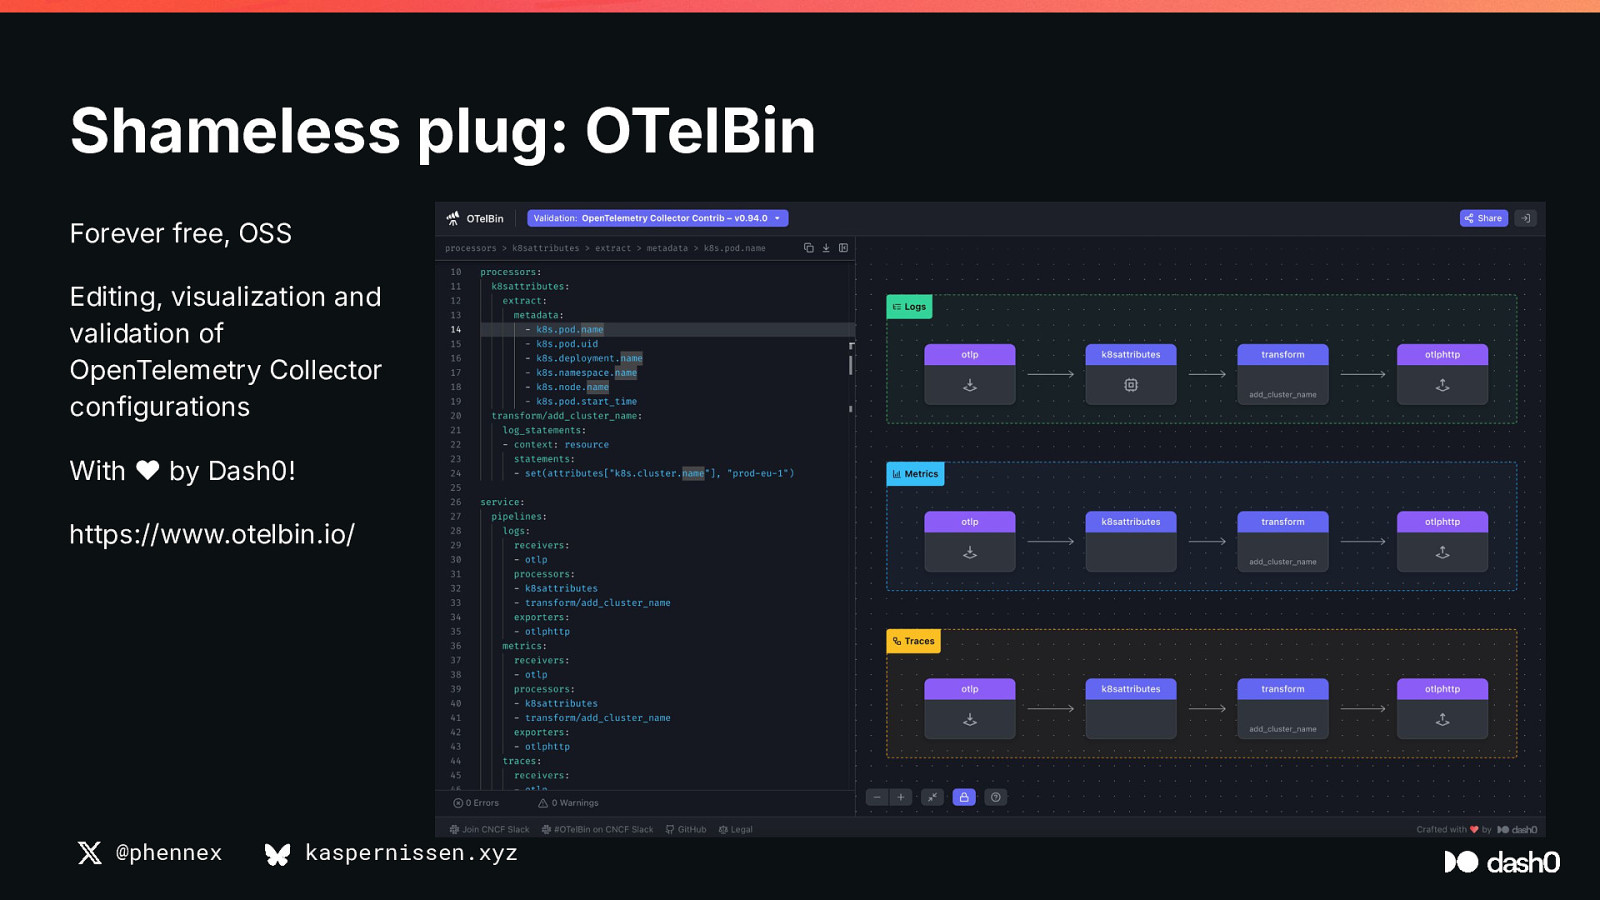
Shameless plug: OTelBin Forever free, OSS Editing, visualization and validation of OpenTelemetry Collector configurations With ❤ by Dash0! https://www.otelbin.io/ @phennex kaspernissen.xyz
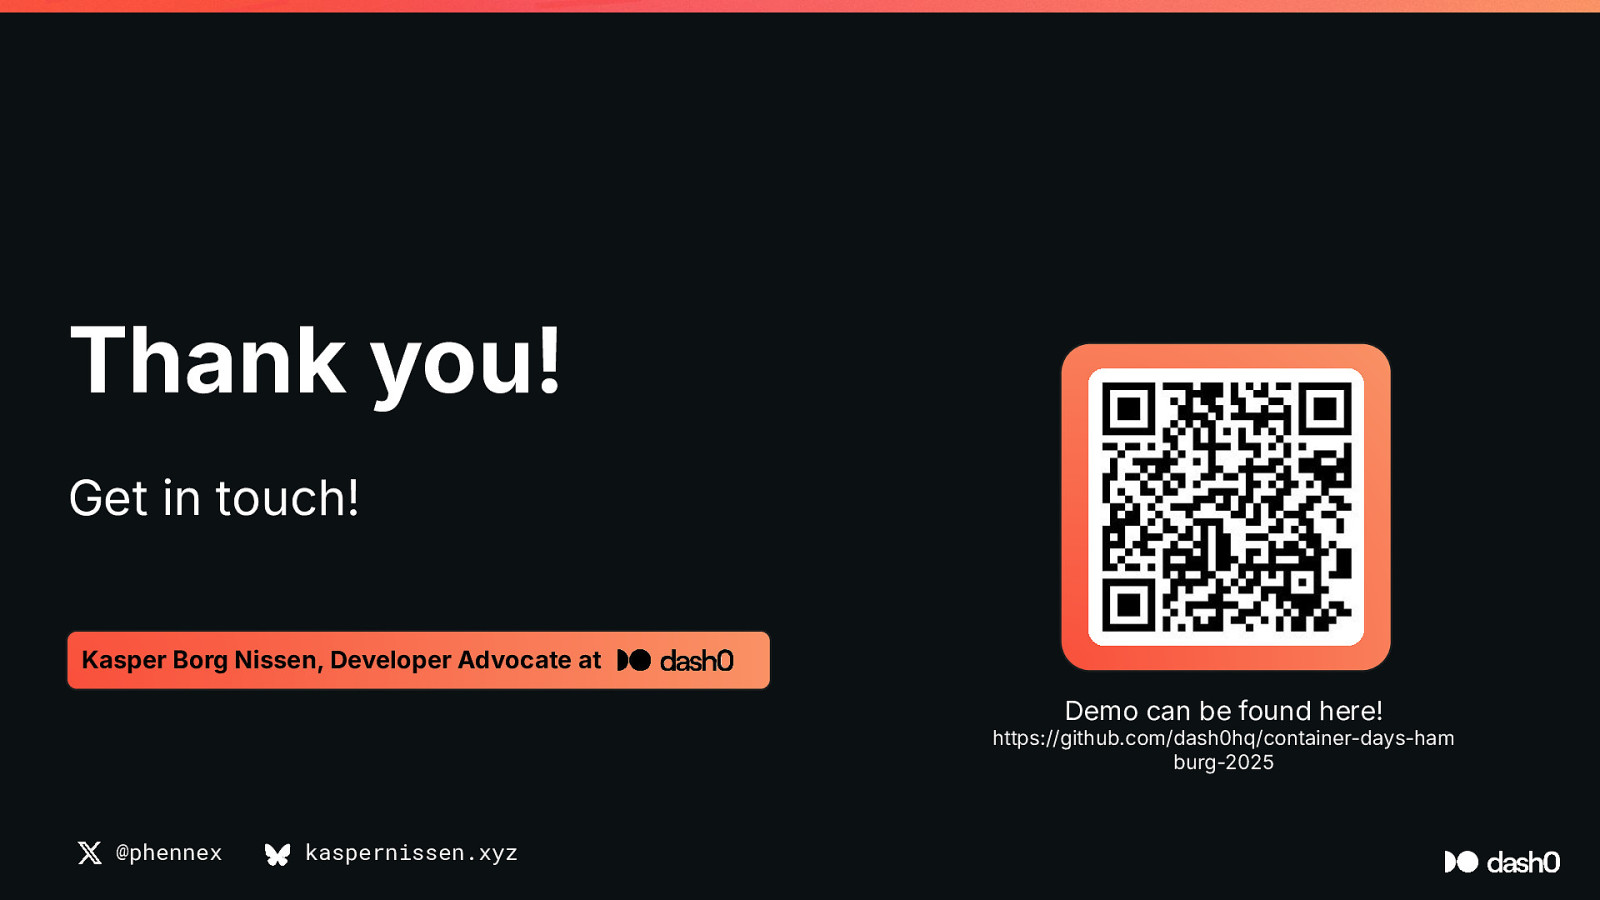
Thank you! Get in touch! Kasper Borg Nissen, Developer Advocate at Demo can be found here! https://github.com/dash0hq/container-days-ham burg-2025 @phennex kaspernissen.xyz

Observability is the backbone of modern cloud-native applications, but many organizations find themselves locked into proprietary tools with rising costs, rigid ecosystems, and limited flexibility. In this talk, we’ll explore how open observability standards like OpenTelemetry for instrumentation and Perses for monitoring-as-code are transforming the landscape by enabling vendor-neutral, scalable, and future-proof observability stacks.
We’ll start with an introduction to OpenTelemetry, covering how to get started, instrument applications, and provide developer-friendly abstractions for seamless auto-instrumentation. From there, we’ll dive into Perses, a CNCF Sandbox project that brings open, declarative, and portable dashboards to observability. By building on these open standards, organizations gain the freedom to mix and match storage, visualization, and analytics tools without being tied to a single vendor.


 for free. You
can too.
for free. You
can too.