
A presentation at FOSDEM in in Brussels, Belgium by Andy Davies

Making sense of Long Animation Frames Andy Davies · Feb 2025 🦋 @andydavies.me Photo by Patrick Fore on Unsplash
It’s tempting to focus on what we can easily measure 🦋 @andydavies.me
It’s tempting to focus on what we can easily measure But what if we really need to focus on things that are harder to measure? 🦋 @andydavies.me
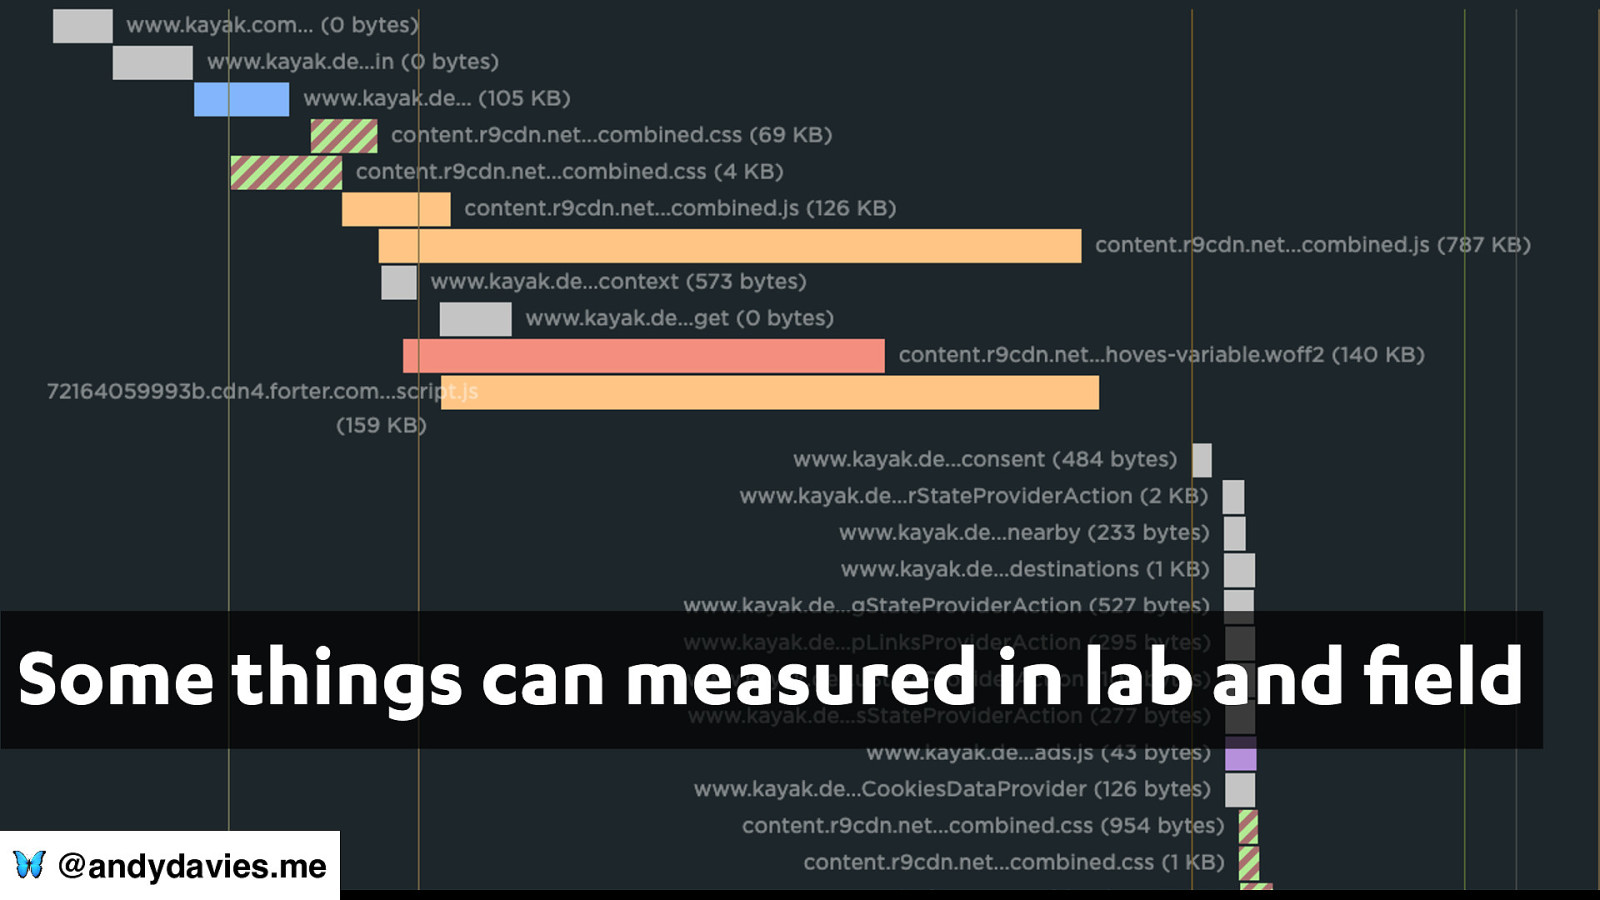
Some things can measured in lab and eld 🦋 @andydavies.me
Others are more di cult… 🦋 @andydavies.me Photo by Lucas Davies on Unsplash
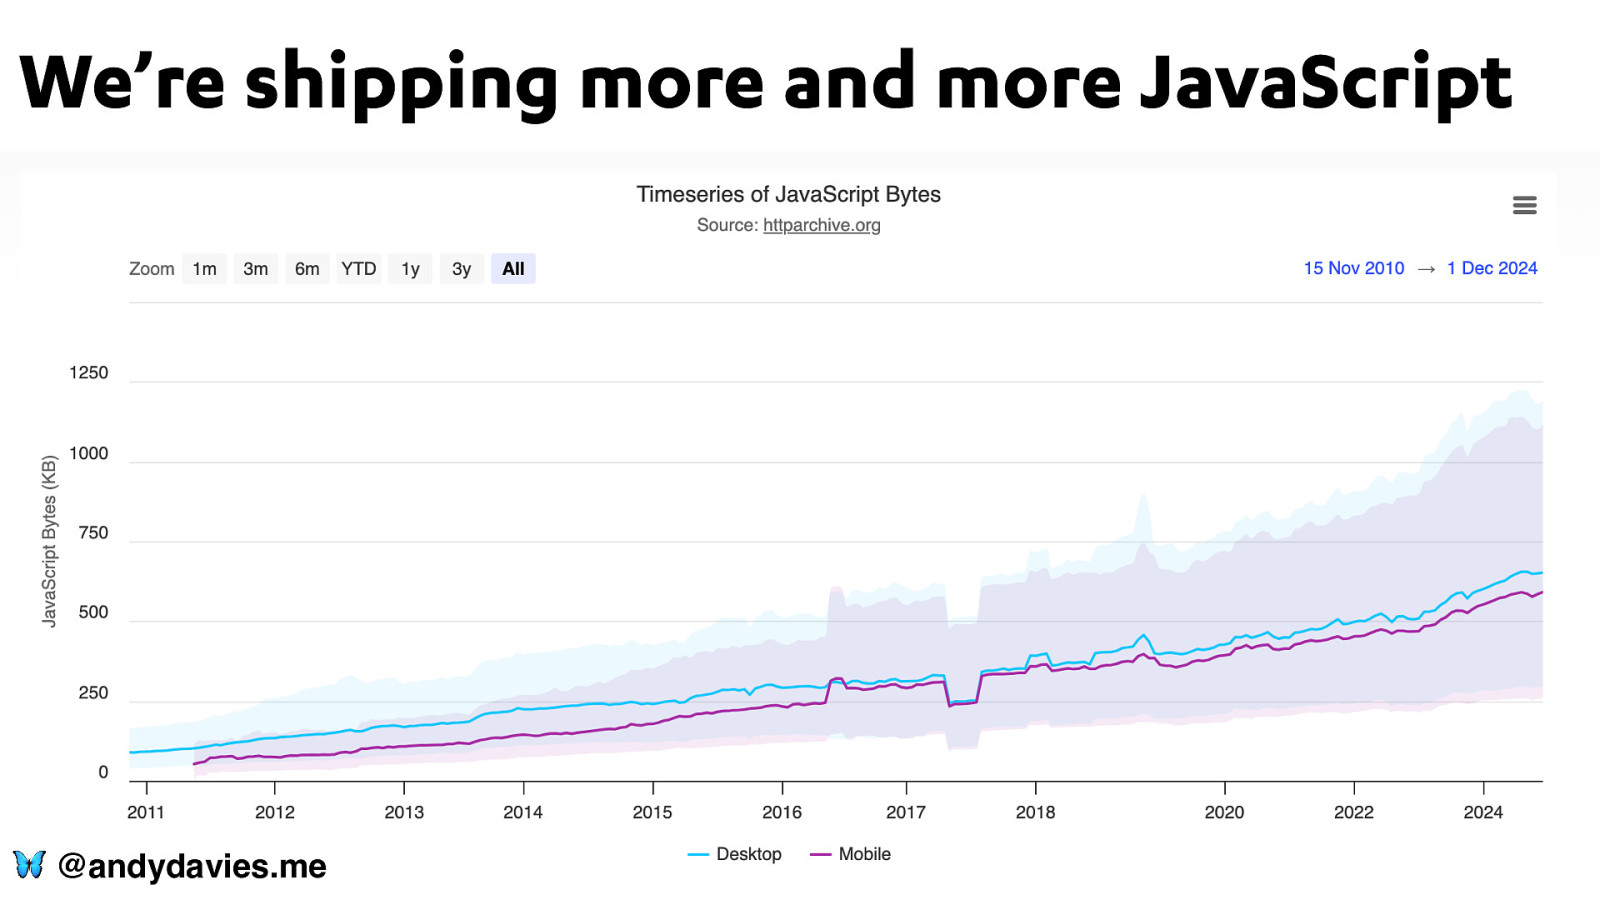
We’re shipping more and more JavaScript 🦋 @andydavies.me
And download size is just the beginning! 🦋 @andydavies.me Photo by Felix M. Dorn on Unsplash
JavaScript’s runtime costs matter too 🦋 @andydavies.me Photo by Jay Heike on Unsplash
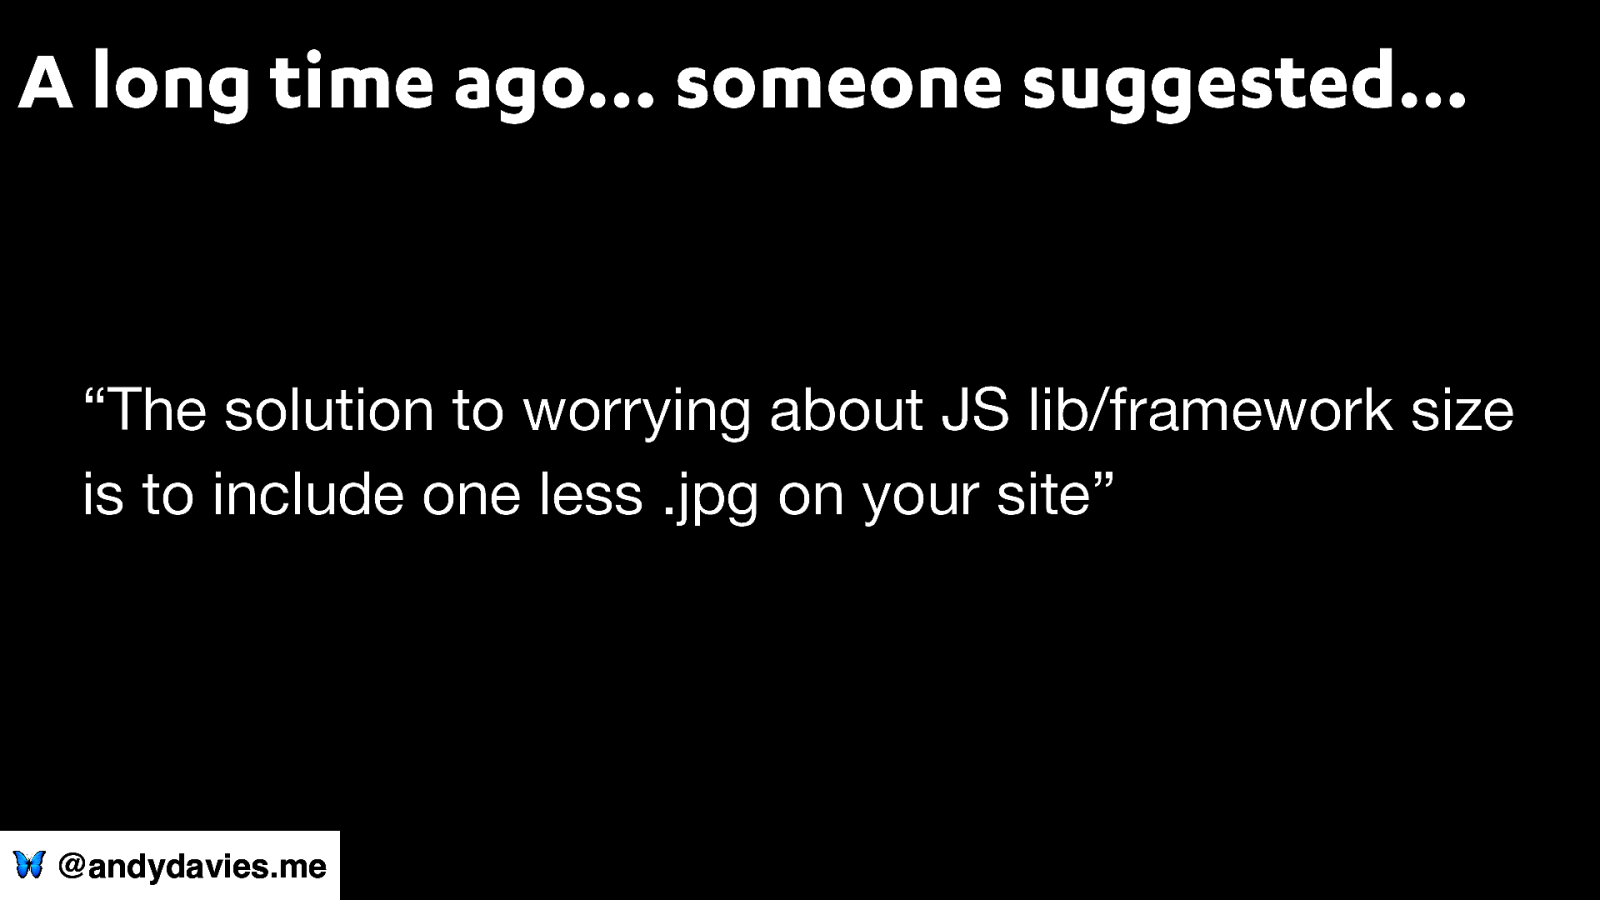
A long time ago… someone suggested… “The solution to worrying about JS lib/framework size is to include one less .jpg on your site” 🦋 @andydavies.me
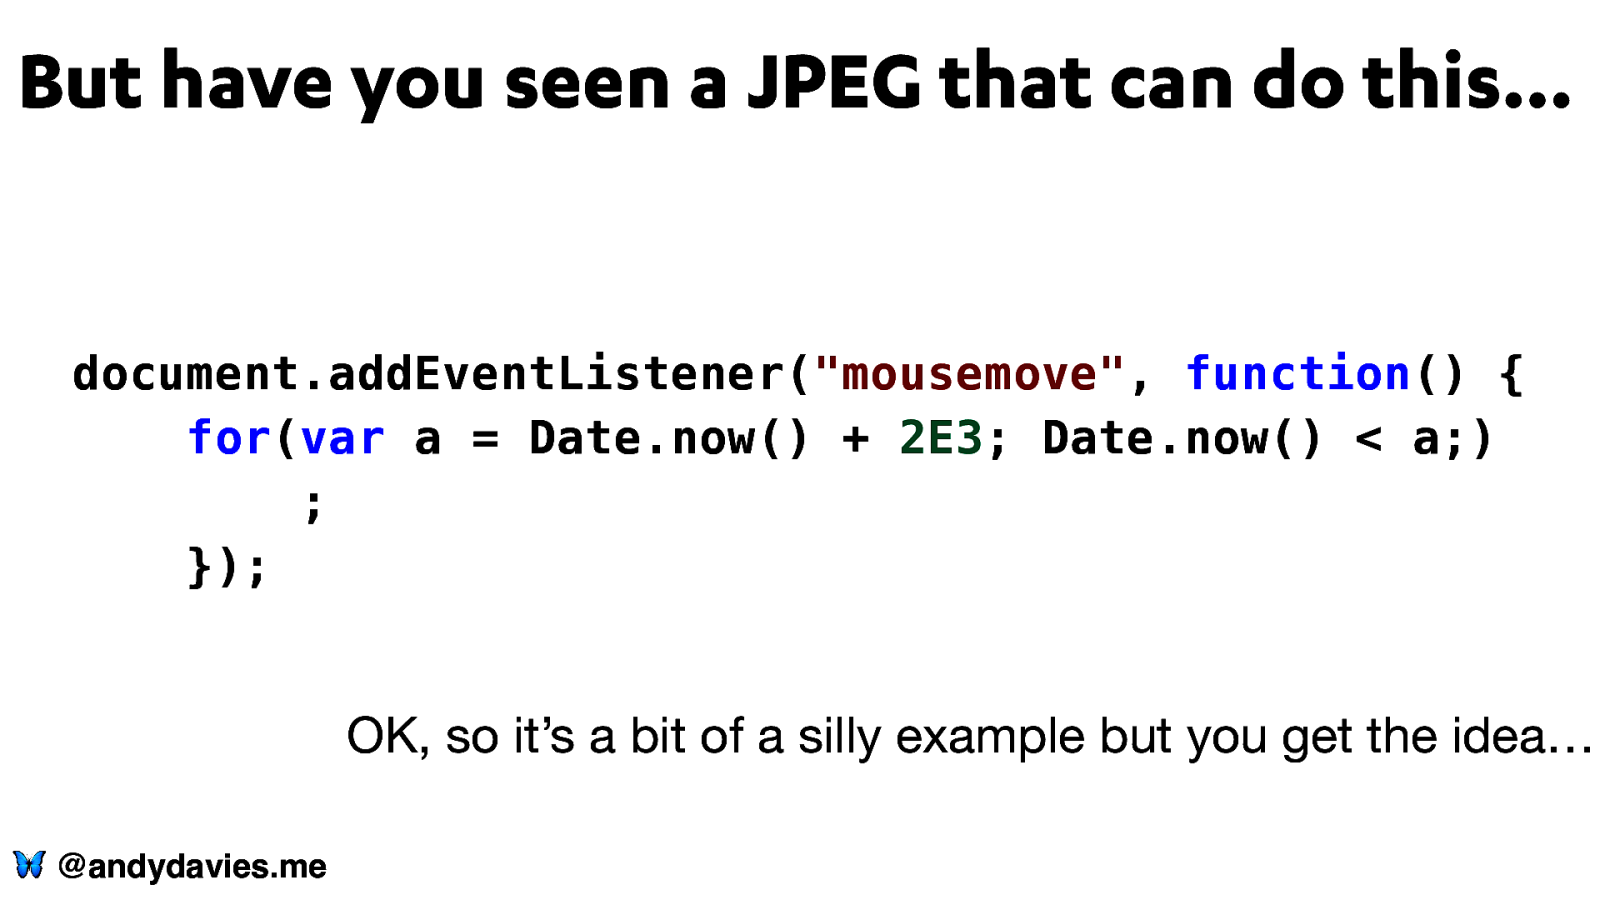
But have you seen a JPEG that can do this… document.addEventListener(“mousemove”, function() { for(var a = Date.now() + 2E3; Date.now() < a;) ; }); OK, so it’s a bit of a silly example but you get the idea… 🦋 @andydavies.me
How do scripts a ect visitors experience? 🦋 @andydavies.me Photo by Julien L on Unsplash
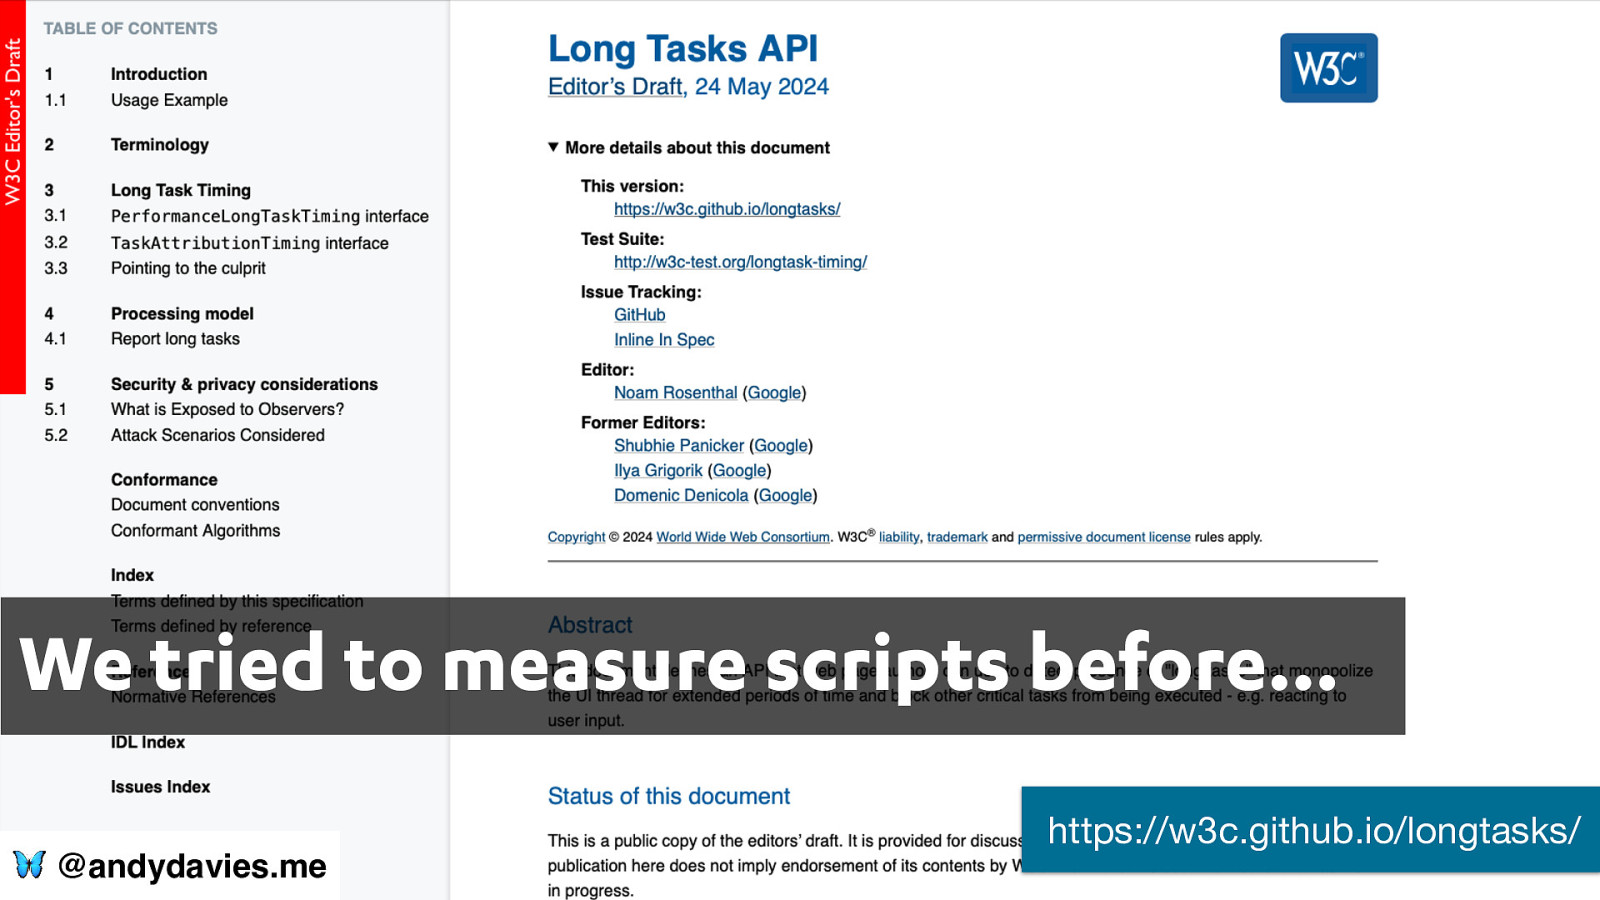
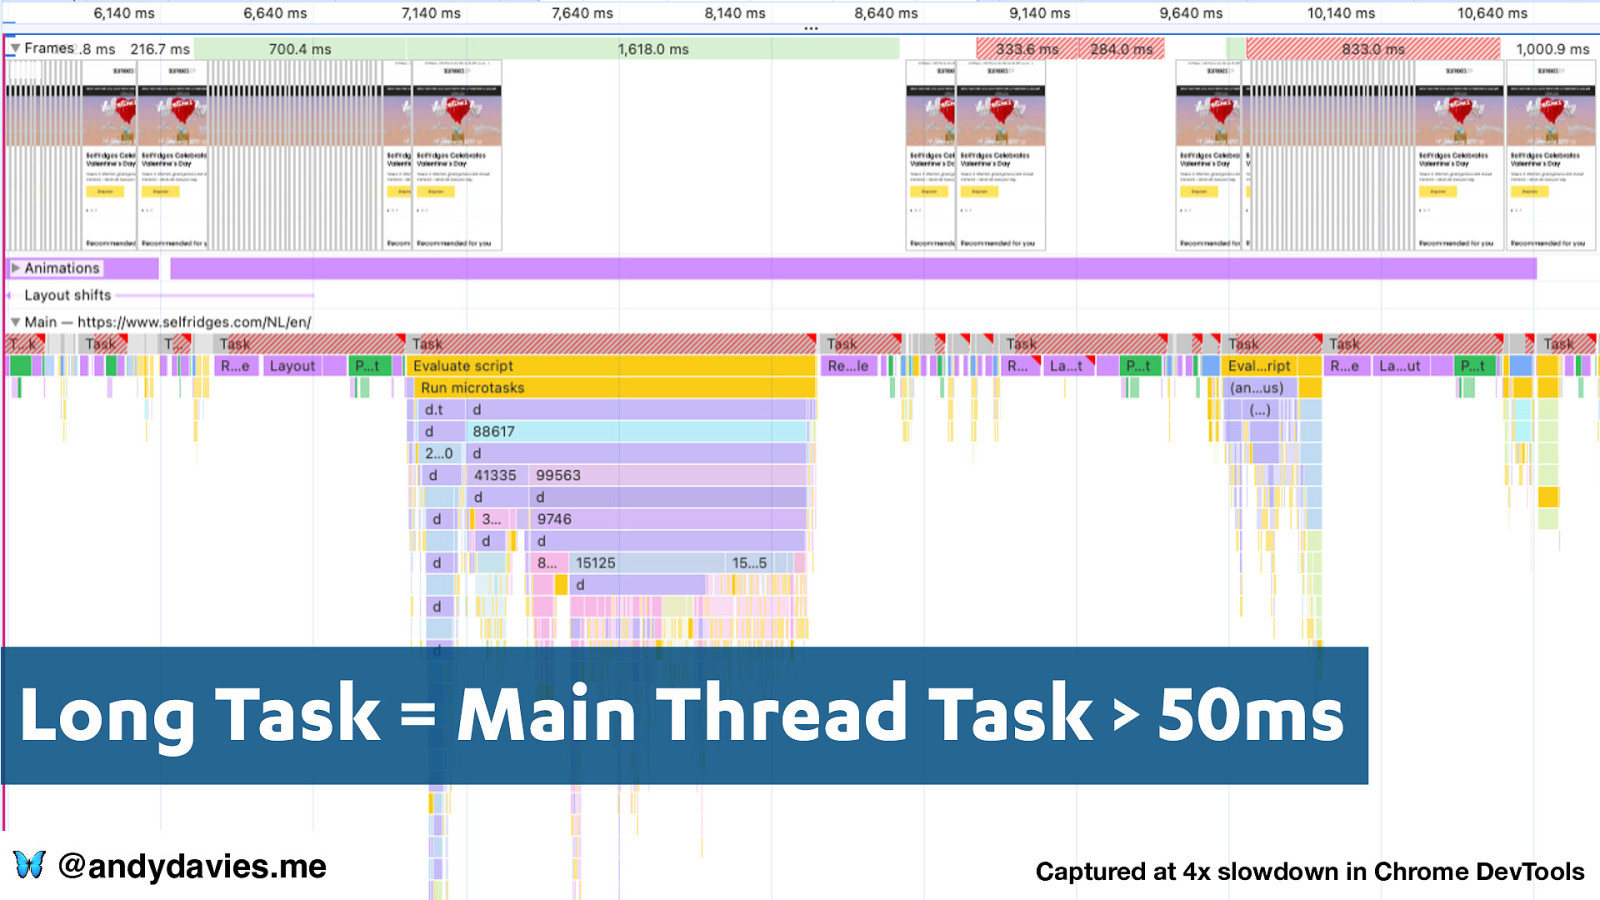
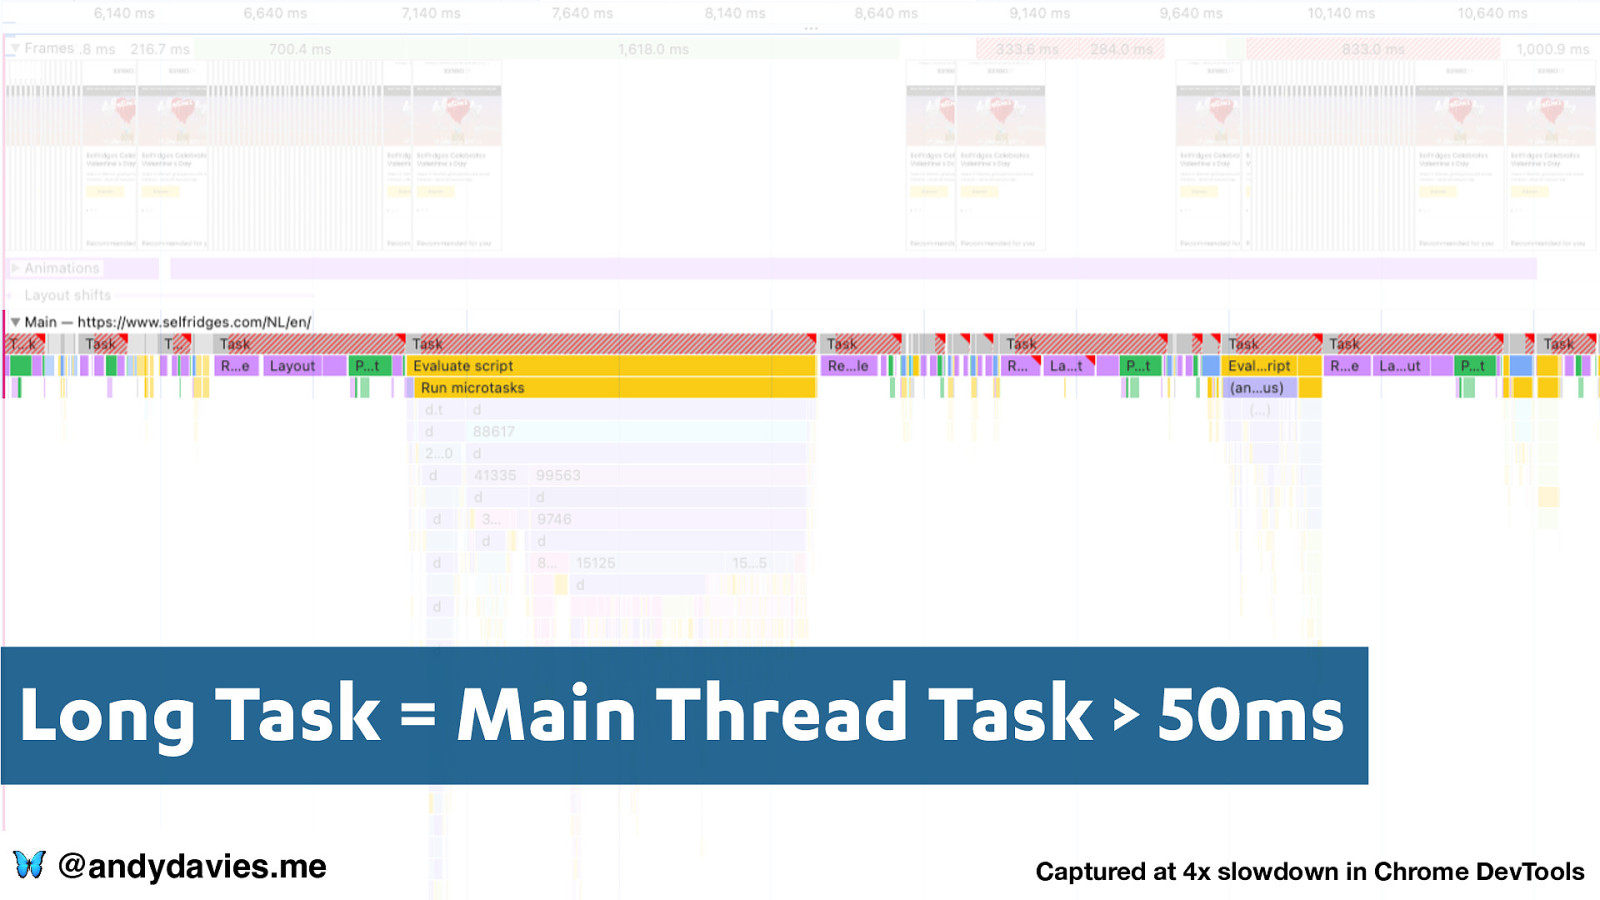
Long Tasks API We tried to measure scripts before… 🦋 @andydavies.me https://w3c.github.io/longtasks/
Long Task = Main Thread Task > 50ms 🦋 @andydavies.me Captured at 4x slowdown in Chrome DevTools
Long Task = Main Thread Task > 50ms 🦋 @andydavies.me Captured at 4x slowdown in Chrome DevTools
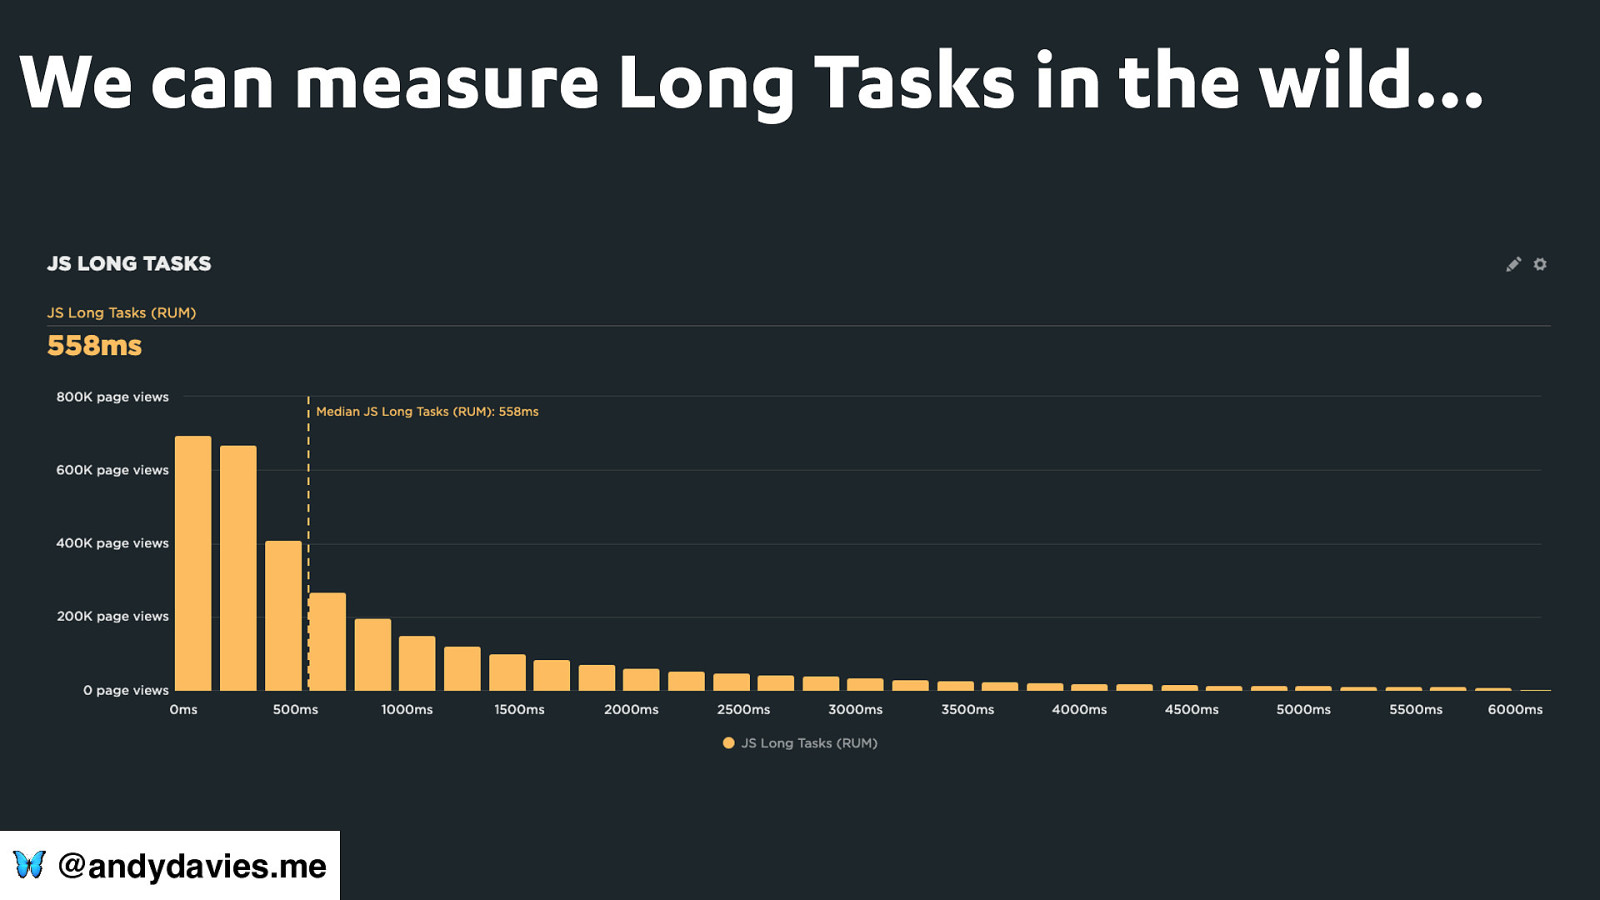
We can measure Long Tasks in the wild… 🦋 @andydavies.me
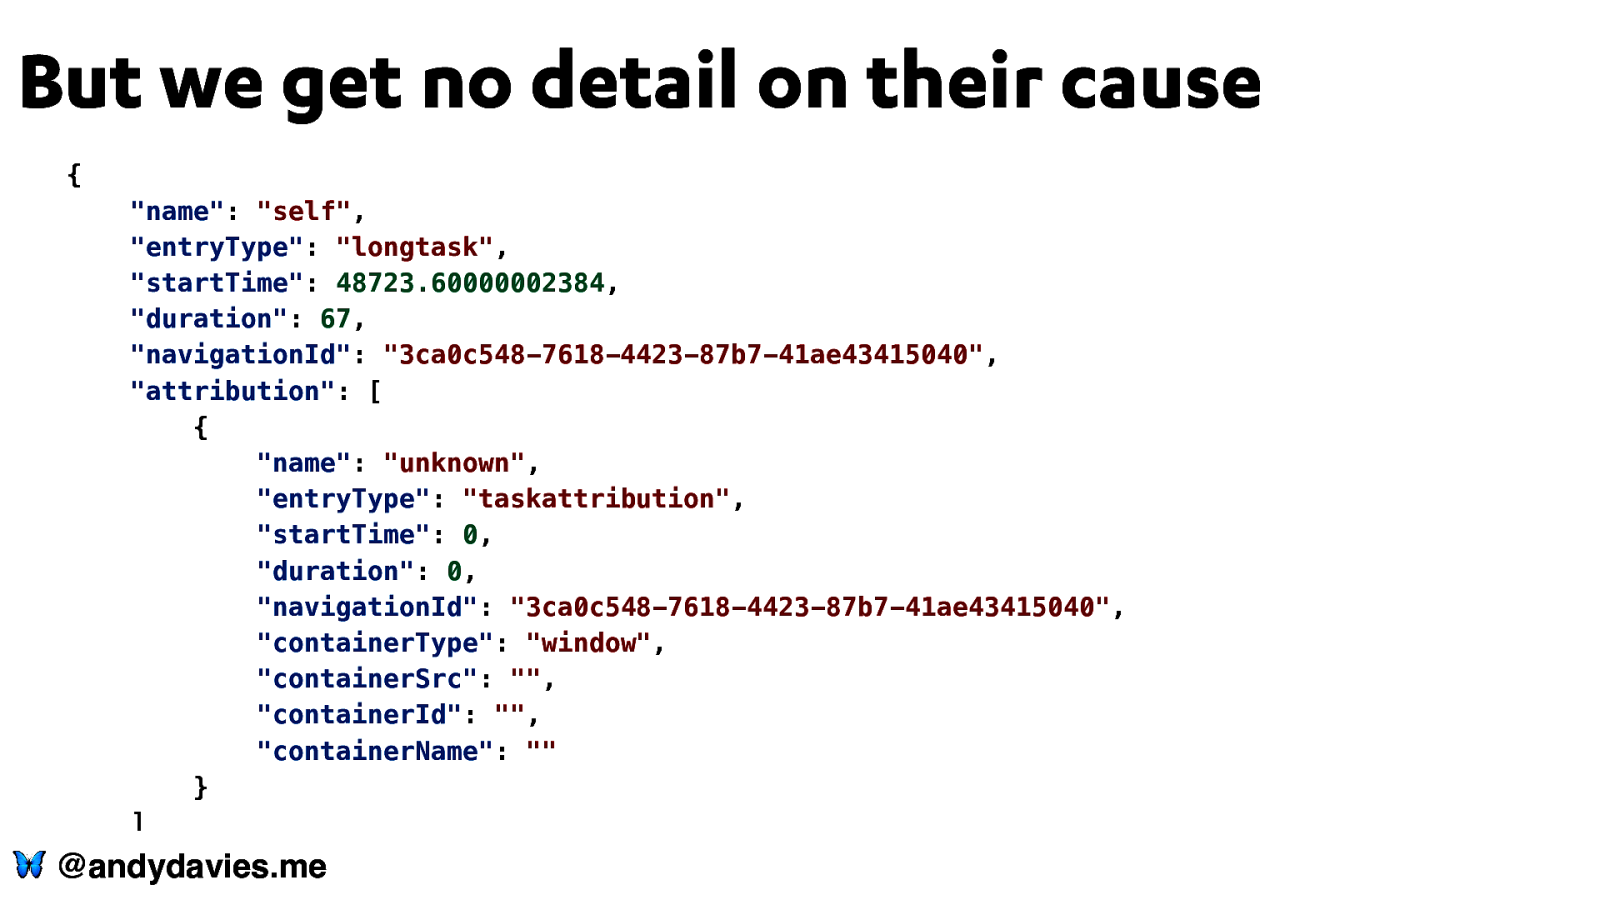
But we get no detail on their cause { “name”: “self”, “entryType”: “longtask”, “startTime”: 48723.60000002384, “duration”: 67, “navigationId”: “3ca0c548-7618-4423-87b7-41ae43415040”, “attribution”: [ { “name”: “unknown”, “entryType”: “taskattribution”, “startTime”: 0, “duration”: 0, “navigationId”: “3ca0c548-7618-4423-87b7-41ae43415040”, “containerType”: “window”, “containerSrc”: “”, “containerId”: “”, “containerName”: “” } ] } 🦋 @andydavies.me
🦋 @andydavies.me Photo by Dušan veverkolog on Unsplash
Will Long Animation Frames rescue us? 🦋 @andydavies.me Photo by Matt Noble on Unsplash
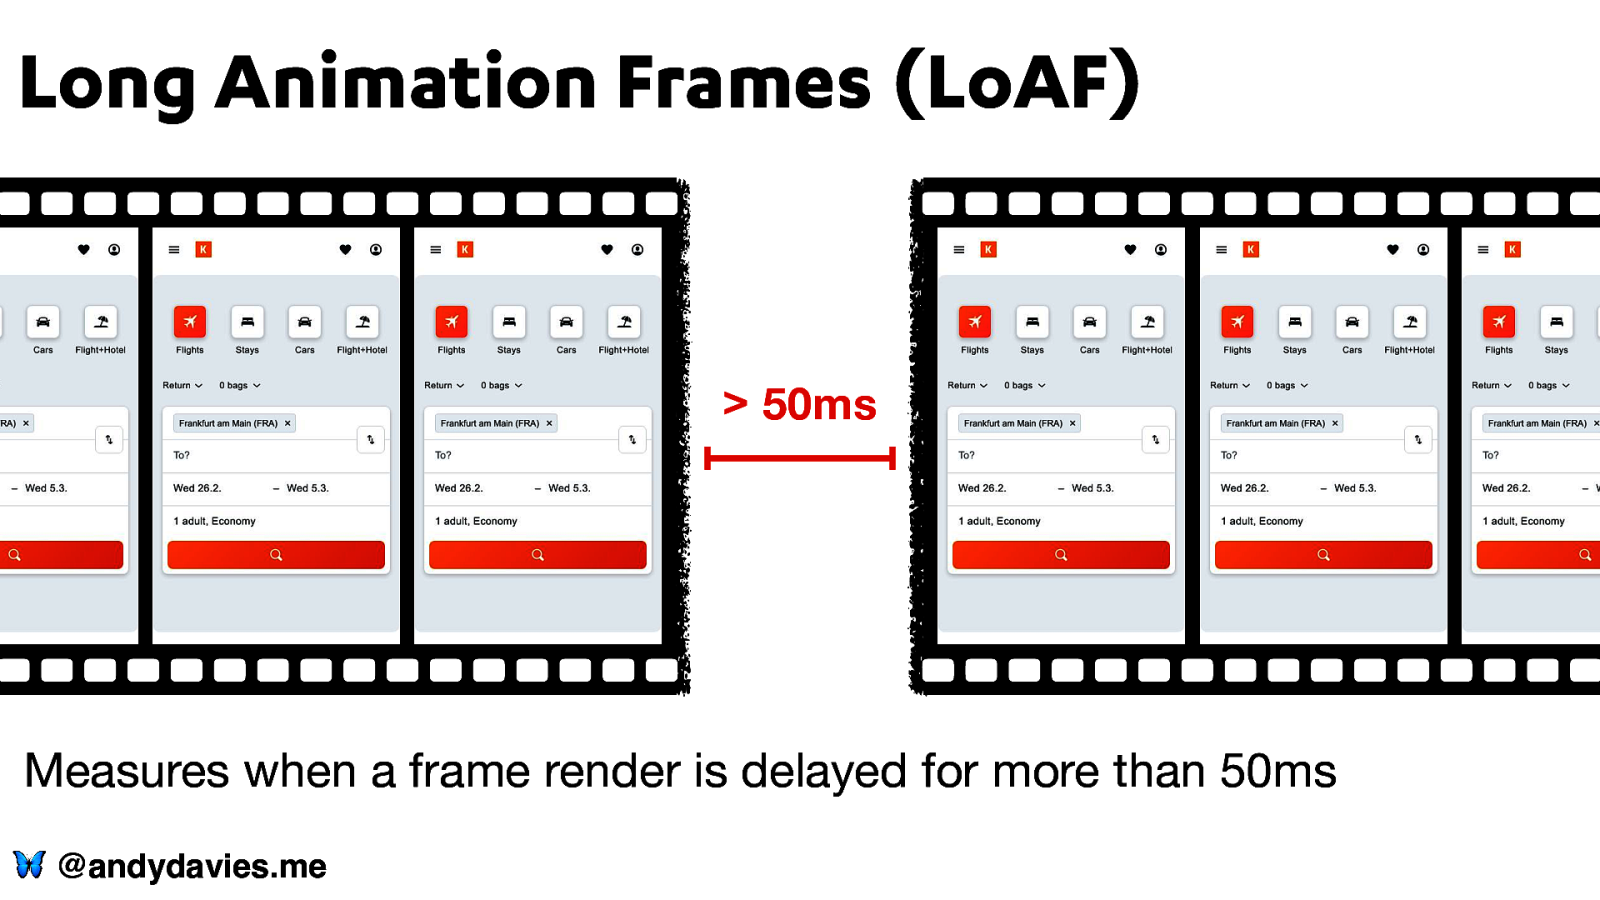
Long Animation Frames (LoAF)
50ms Measures when a frame render is delayed for more than 50ms 🦋 @andydavies.me
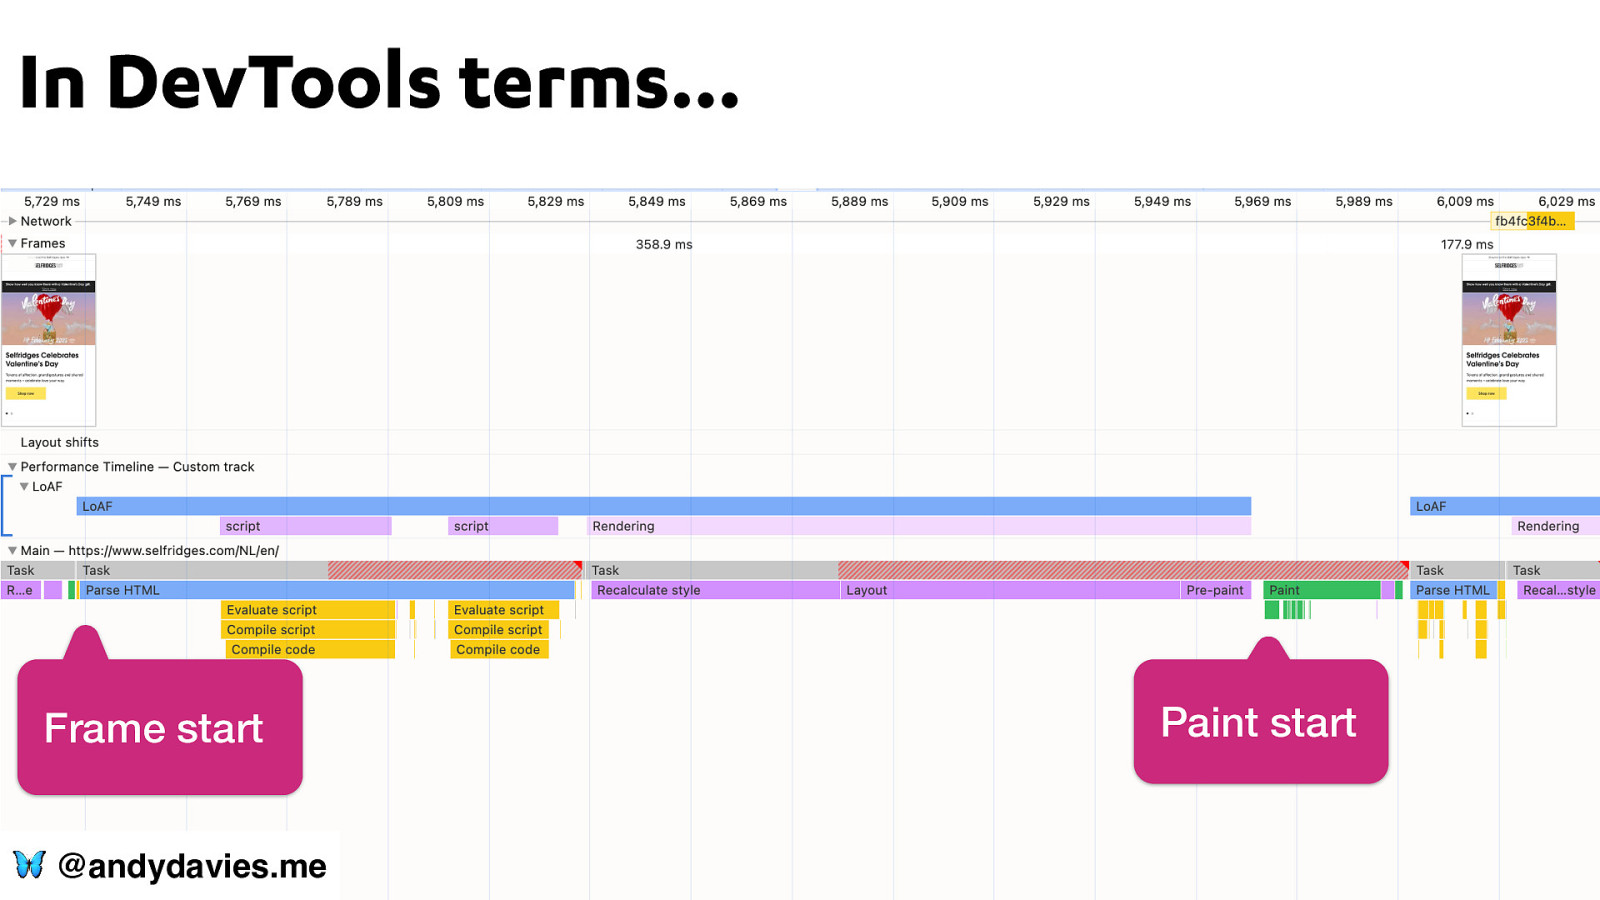
In DevTools terms… Frame start 🦋 @andydavies.me Paint start
Available in Chromium based browsers 🦋 @andydavies.me
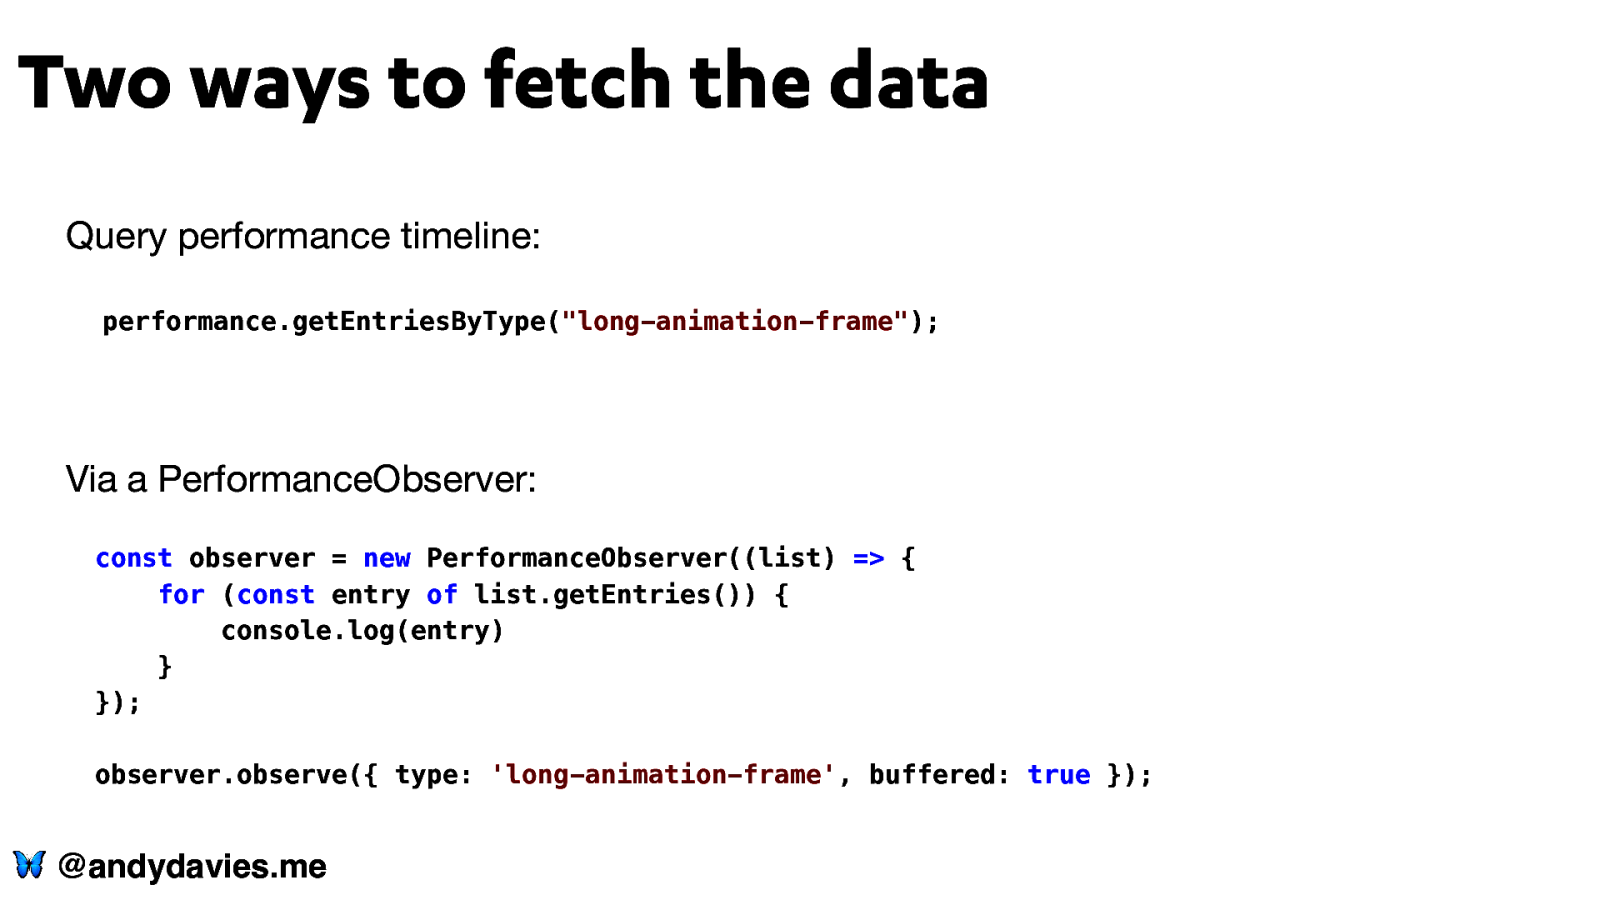
Two ways to fetch the data Query performance timeline: performance.getEntriesByType(“long-animation-frame”); Via a PerformanceObserver: const observer = new PerformanceObserver((list) => { for (const entry of list.getEntries()) { console.log(entry) } }); observer.observe({ type: ‘long-animation-frame’, buffered: true }); 🦋 @andydavies.me
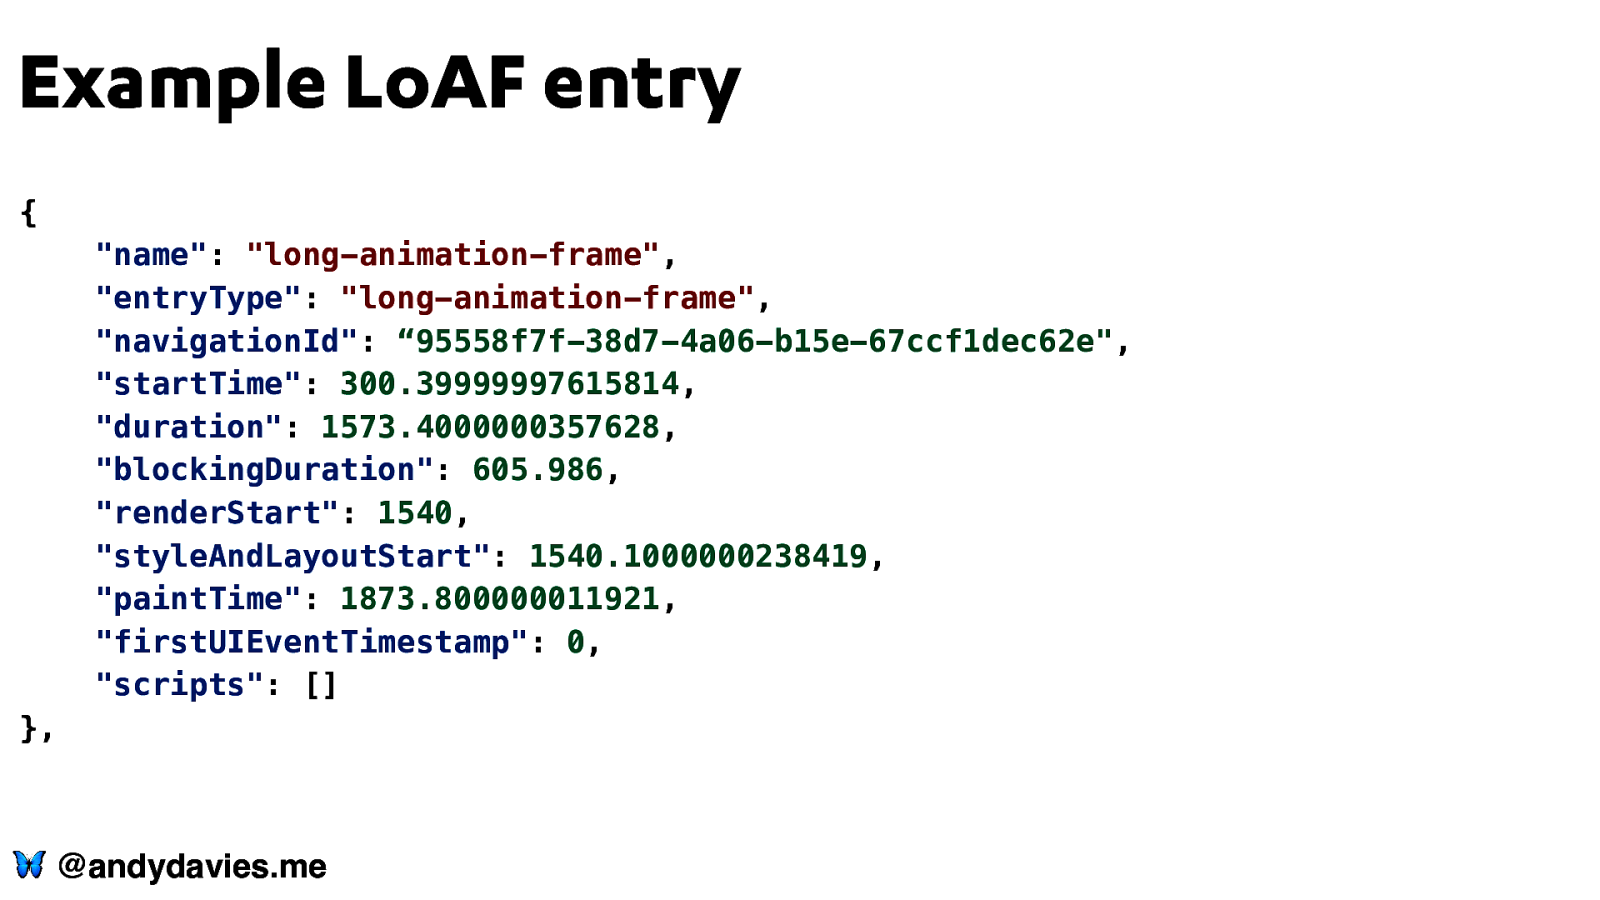
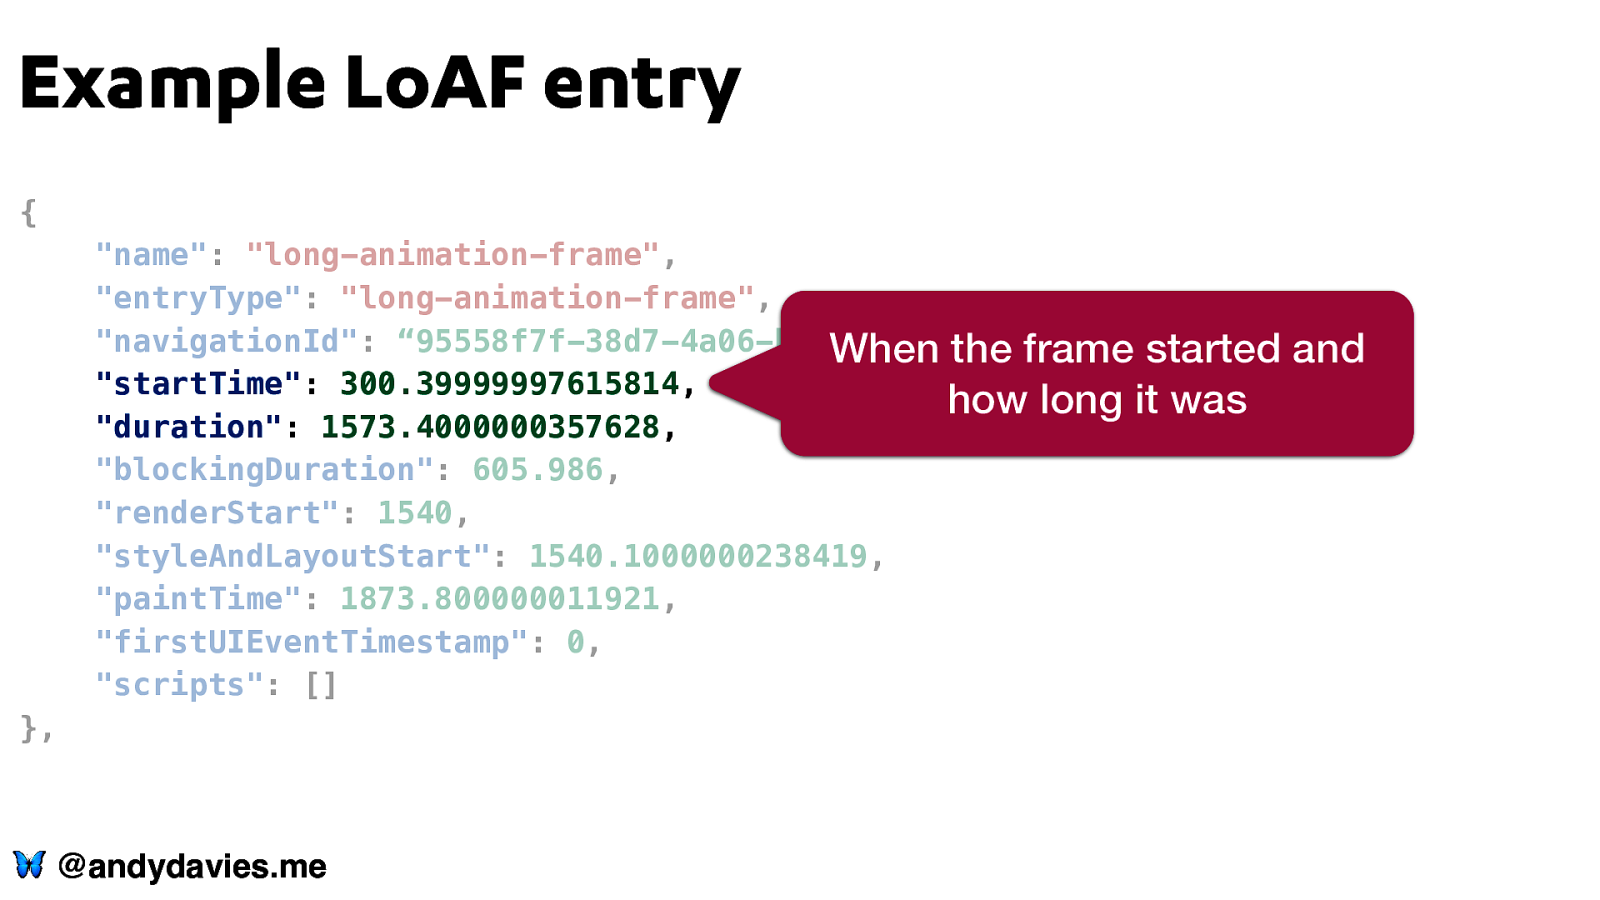
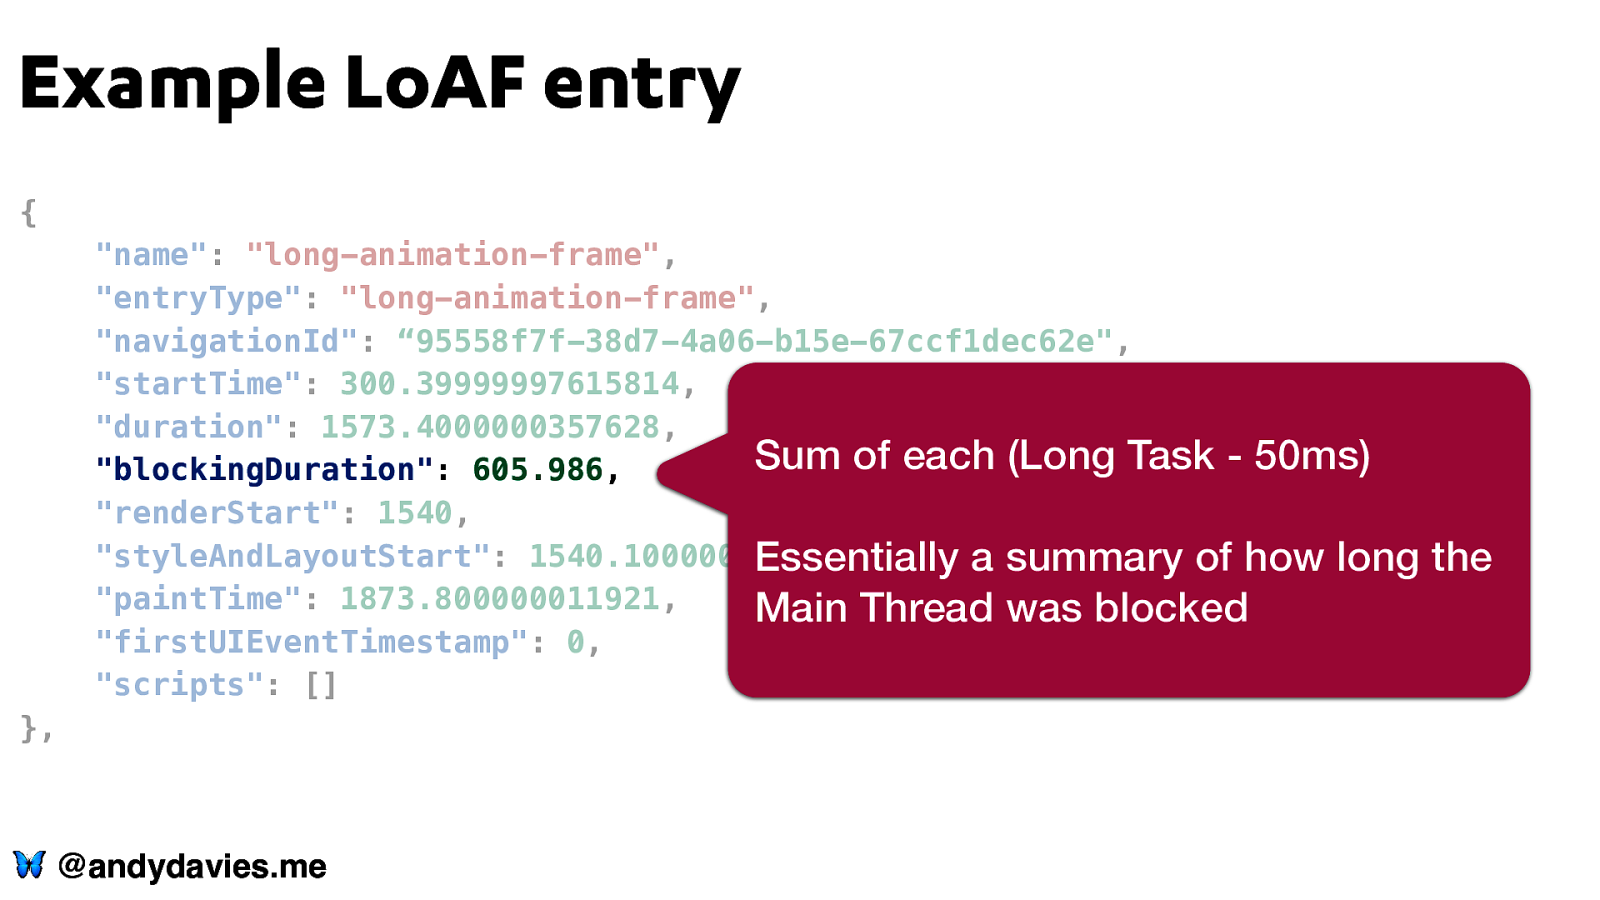
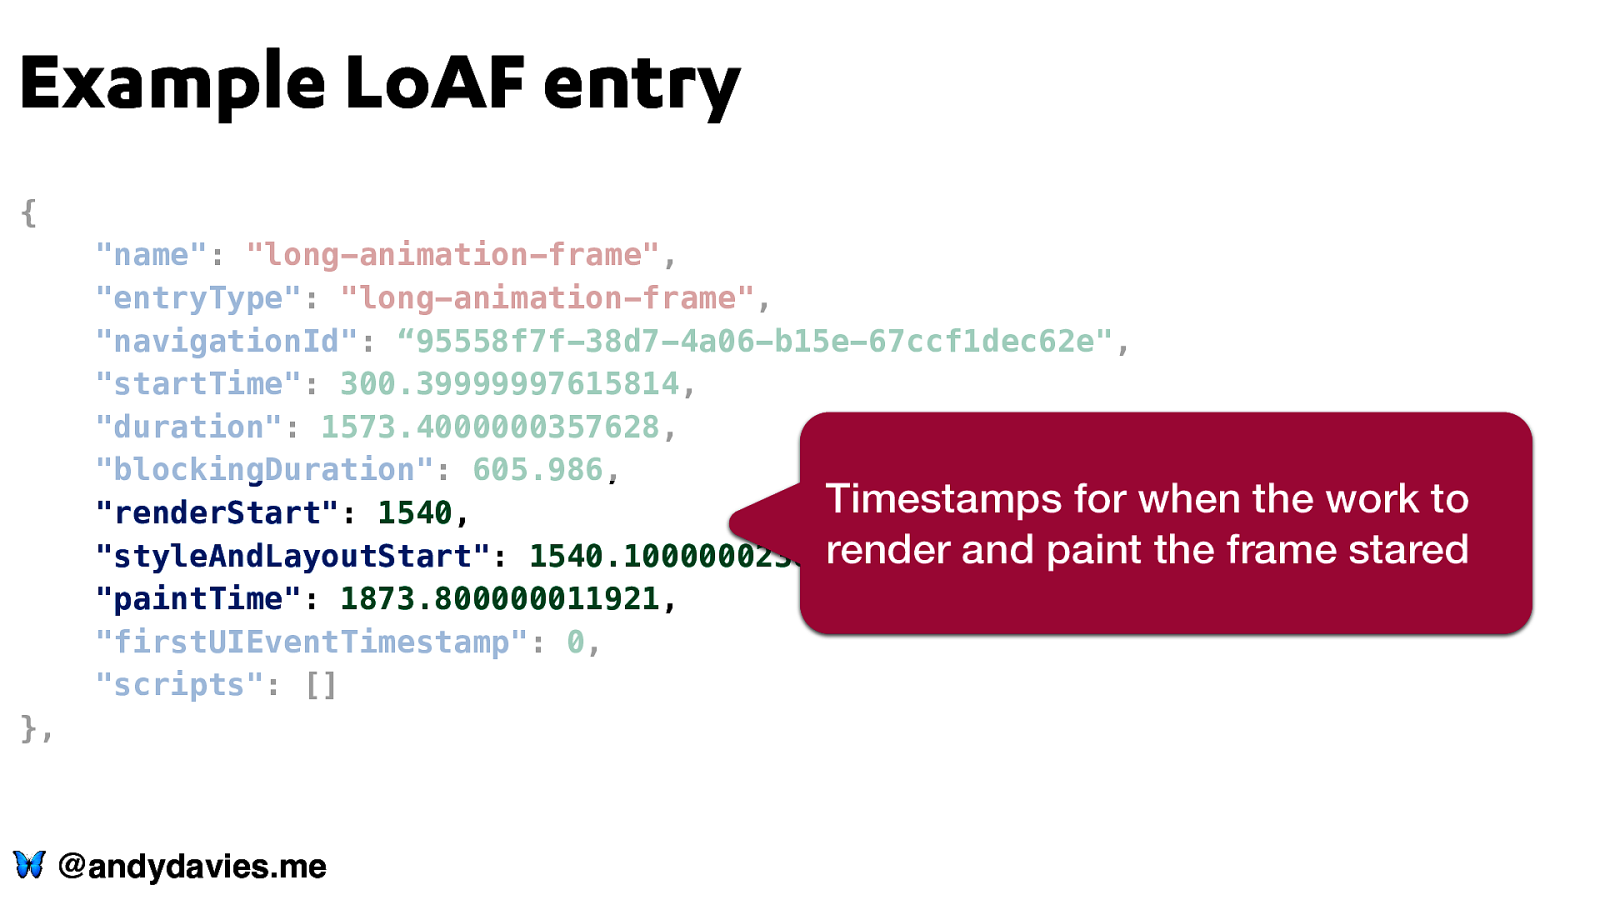
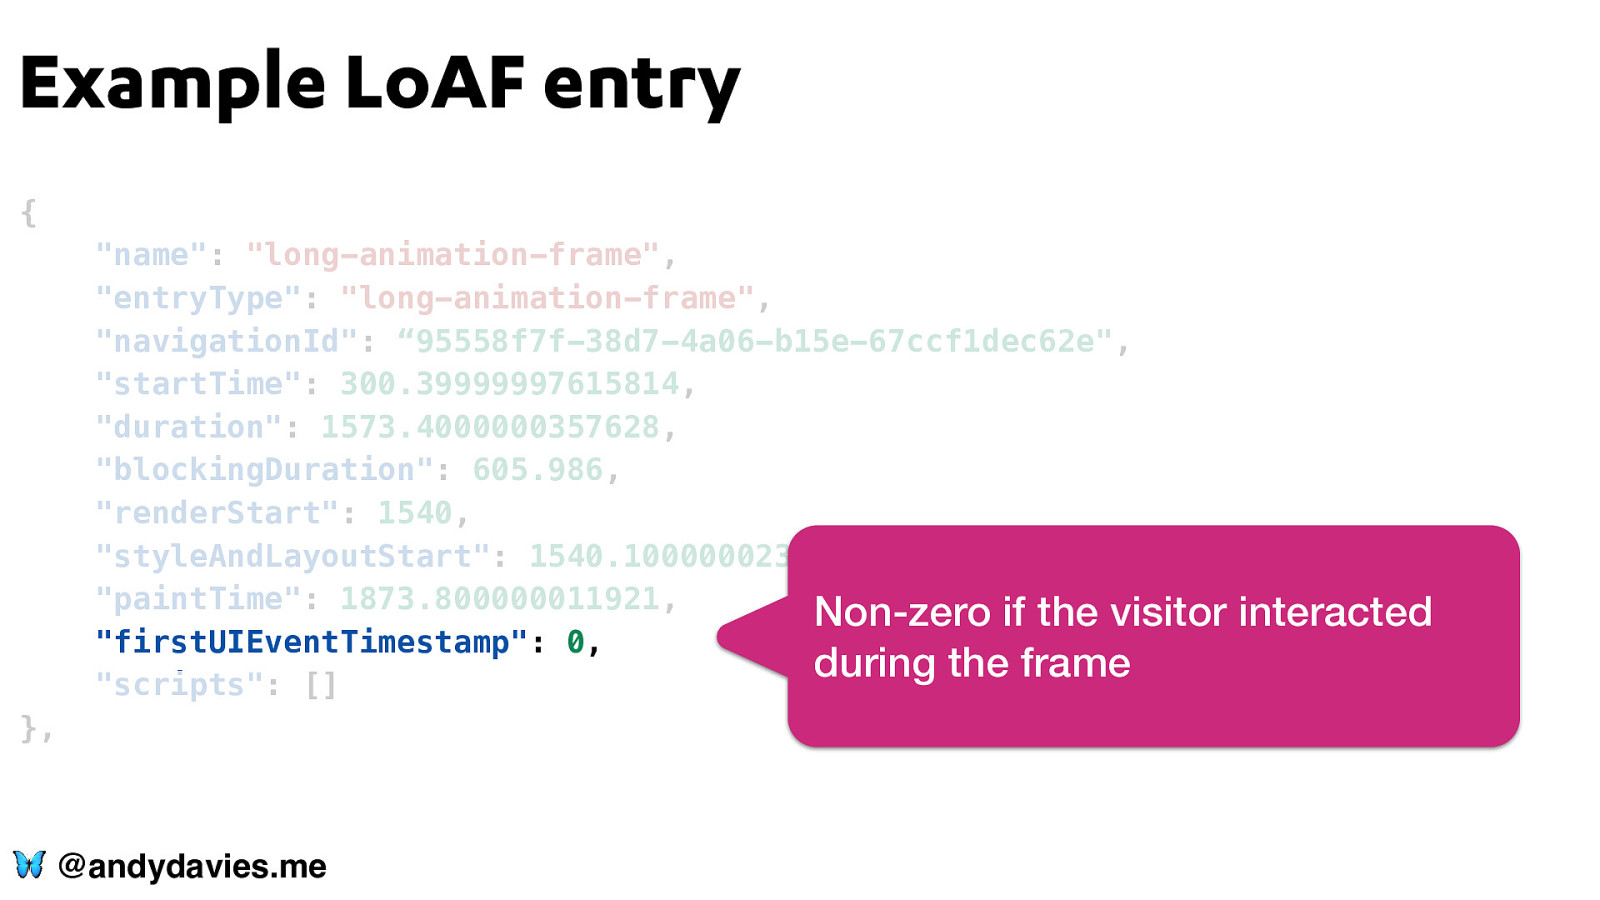
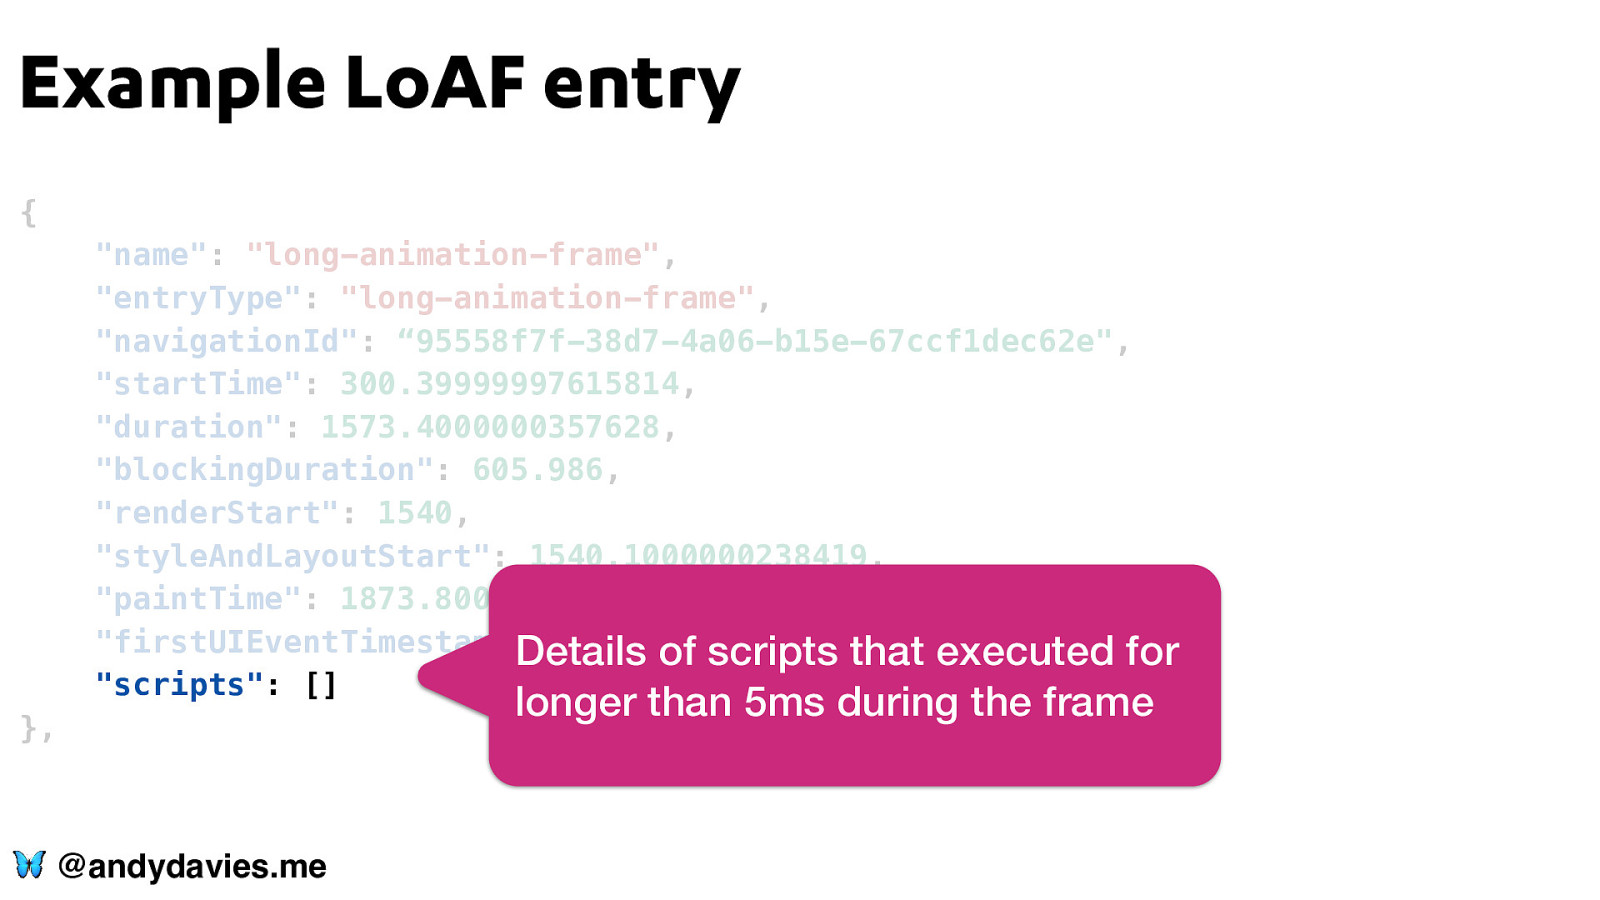
Example LoAF entry { “name”: “long-animation-frame”, “entryType”: “long-animation-frame”, “navigationId”: “95558f7f-38d7-4a06-b15e-67ccf1dec62e”, “startTime”: 300.39999997615814, “duration”: 1573.4000000357628, “blockingDuration”: 605.986, “renderStart”: 1540, “styleAndLayoutStart”: 1540.1000000238419, “paintTime”: 1873.800000011921, “firstUIEventTimestamp”: 0, “scripts”: [] }, 🦋 @andydavies.me
Example LoAF entry { “name”: “long-animation-frame”, “entryType”: “long-animation-frame”, “navigationId”: “95558f7f-38d7-4a06-b15e-67ccf1dec62e”, When the frame started “startTime”: 300.39999997615814, how long it was “duration”: 1573.4000000357628, “blockingDuration”: 605.986, “renderStart”: 1540, “styleAndLayoutStart”: 1540.1000000238419, “paintTime”: 1873.800000011921, “firstUIEventTimestamp”: 0, “scripts”: [] }, 🦋 @andydavies.me and
Example LoAF entry { “name”: “long-animation-frame”, “entryType”: “long-animation-frame”, “navigationId”: “95558f7f-38d7-4a06-b15e-67ccf1dec62e”, “startTime”: 300.39999997615814, “duration”: 1573.4000000357628, Sum of each (Long Task 50ms) “blockingDuration”: 605.986, “renderStart”: 1540, “styleAndLayoutStart”: 1540.1000000238419, Essentially a summary of how long “paintTime”: 1873.800000011921, Main Thread was blocked “firstUIEventTimestamp”: 0, “scripts”: [] }, 🦋 @andydavies.me the
Example LoAF entry { “name”: “long-animation-frame”, “entryType”: “long-animation-frame”, “navigationId”: “95558f7f-38d7-4a06-b15e-67ccf1dec62e”, “startTime”: 300.39999997615814, “duration”: 1573.4000000357628, “blockingDuration”: 605.986, Timestamps for when the work to “renderStart”: 1540, render and paint the frame stared “styleAndLayoutStart”: 1540.1000000238419, “paintTime”: 1873.800000011921, “firstUIEventTimestamp”: 0, “scripts”: [] }, 🦋 @andydavies.me
Example LoAF entry { “name”: “long-animation-frame”, “entryType”: “long-animation-frame”, “navigationId”: “95558f7f-38d7-4a06-b15e-67ccf1dec62e”, “startTime”: 300.39999997615814, “duration”: 1573.4000000357628, “blockingDuration”: 605.986, “renderStart”: 1540, “styleAndLayoutStart”: 1540.1000000238419, “paintTime”: 1873.800000011921, Non-zero if the visitor “firstUIEventTimestamp”: 0, during the frame “scripts”: [] }, 🦋 @andydavies.me interacted
Example LoAF entry { “name”: “long-animation-frame”, “entryType”: “long-animation-frame”, “navigationId”: “95558f7f-38d7-4a06-b15e-67ccf1dec62e”, “startTime”: 300.39999997615814, “duration”: 1573.4000000357628, “blockingDuration”: 605.986, “renderStart”: 1540, “styleAndLayoutStart”: 1540.1000000238419, “paintTime”: 1873.800000011921, “firstUIEventTimestamp”: 0, Details of scripts that executed for “scripts”: [] }, 🦋 @andydavies.me longer than 5ms during the frame
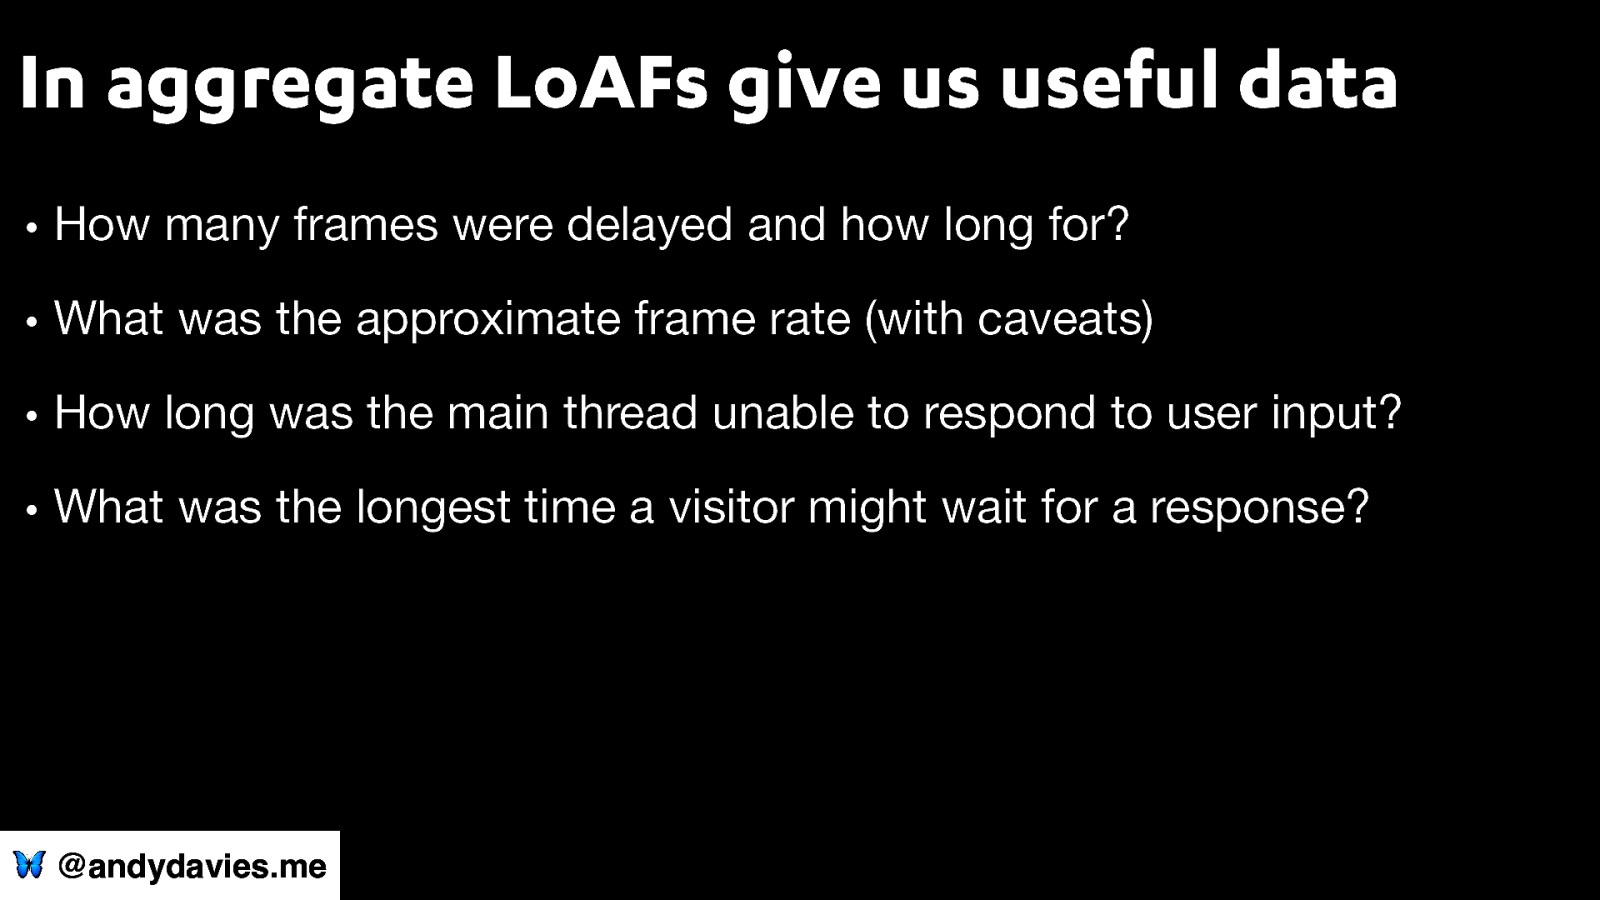
In aggregate LoAFs give us useful data • How many frames were delayed and how long for? • What was the approximate frame rate (with caveats) • How long was the main thread unable to respond to user input? • What was the longest time a visitor might wait for a response? 🦋 @andydavies.me
But I’m most interested in what they tell us about script execution
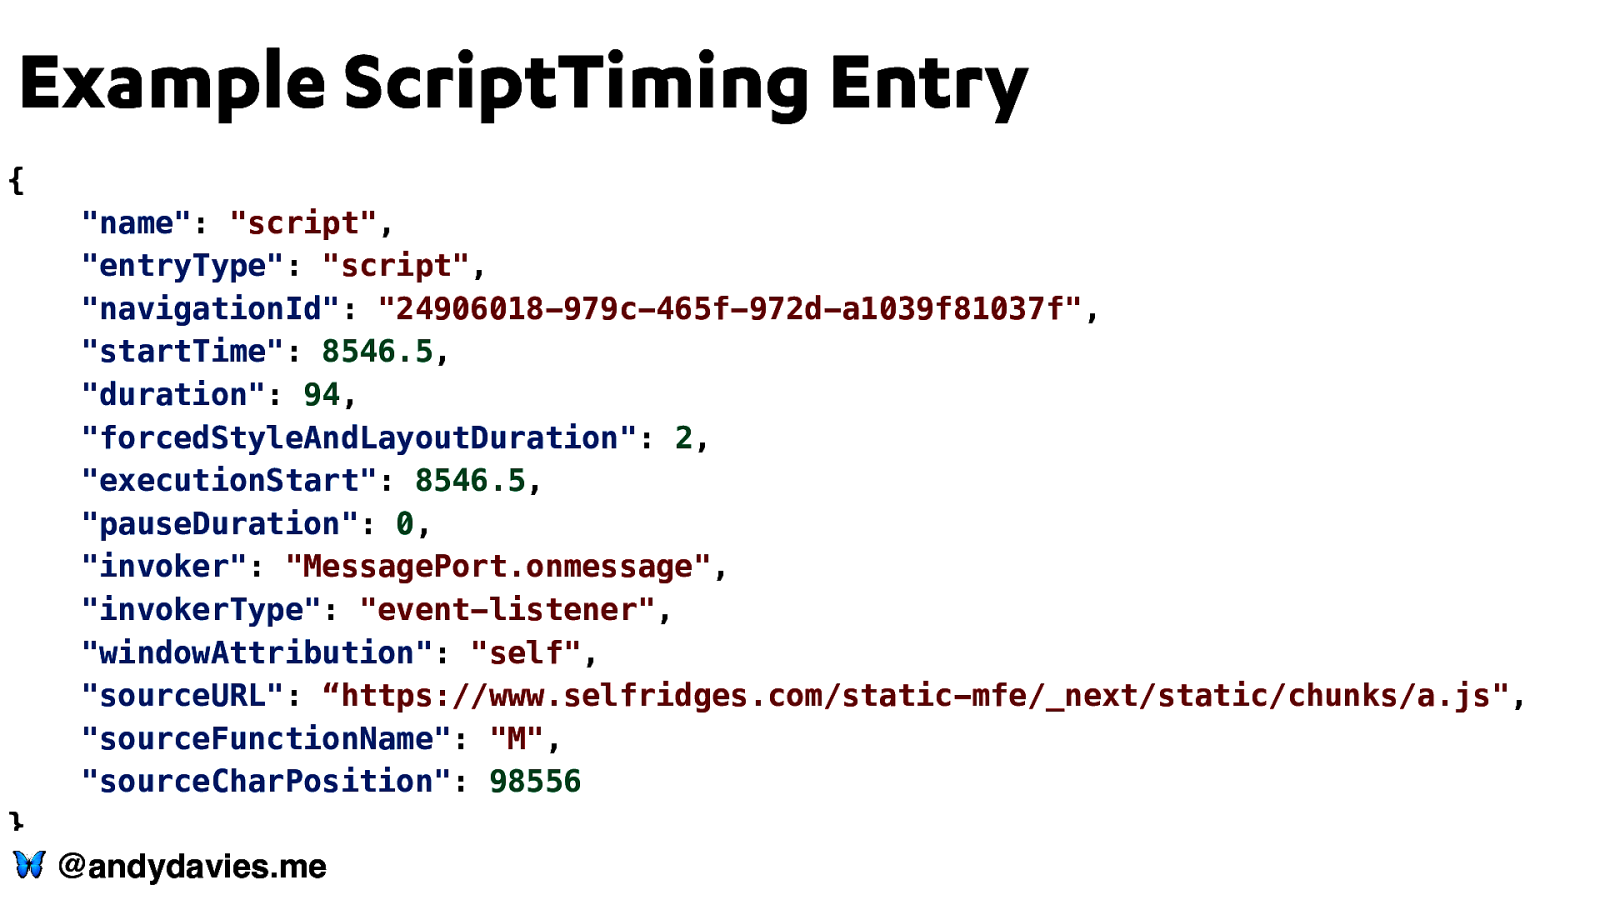
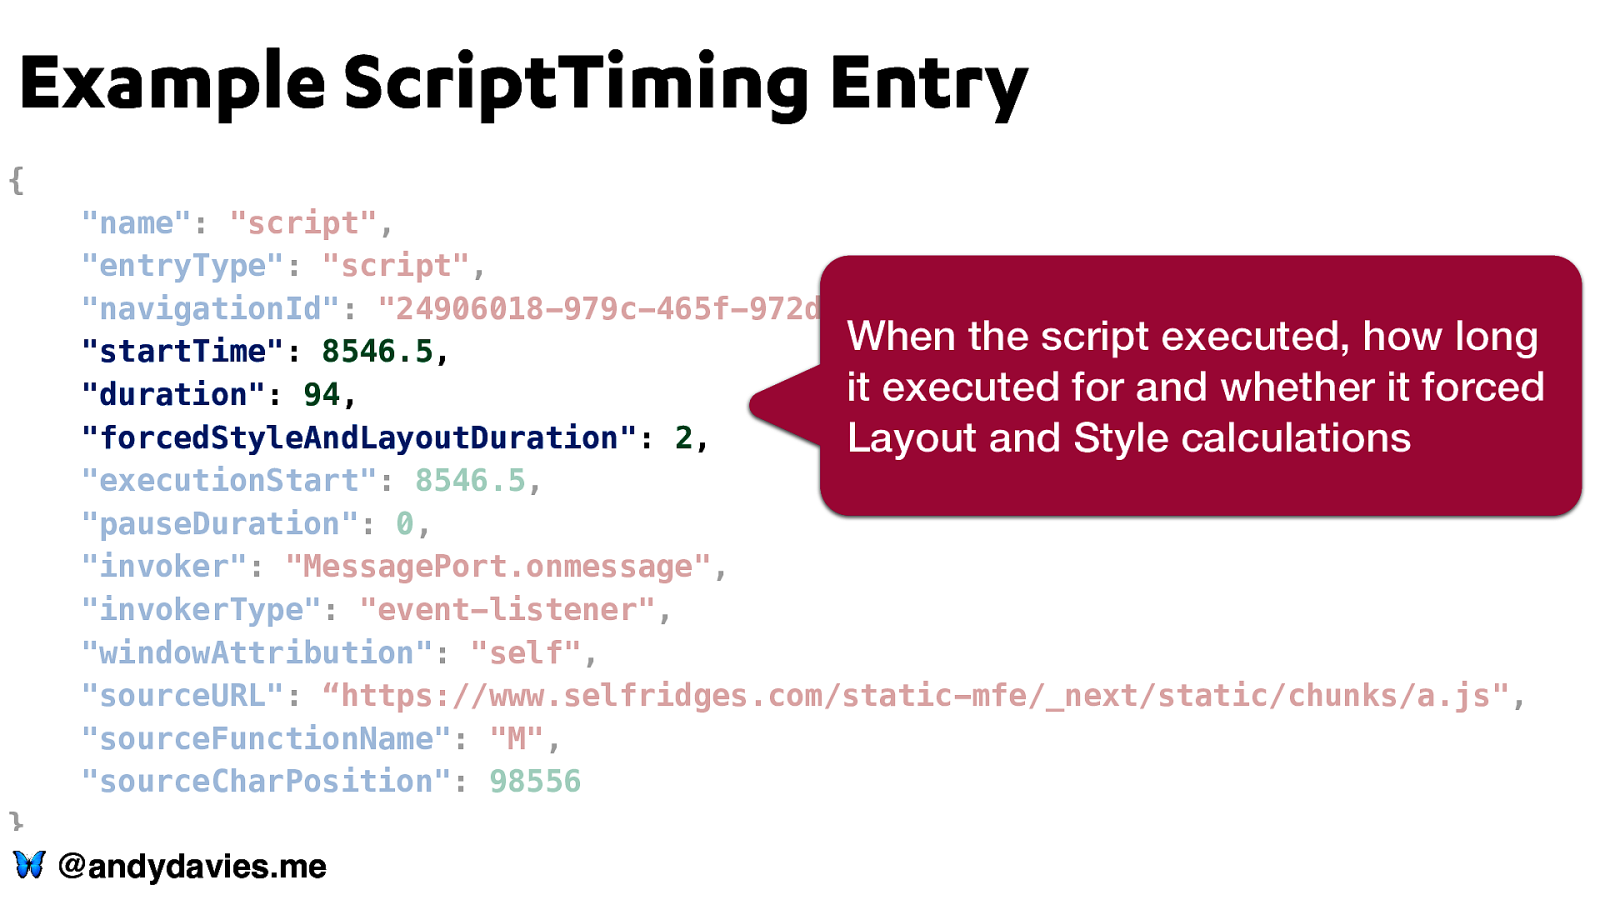
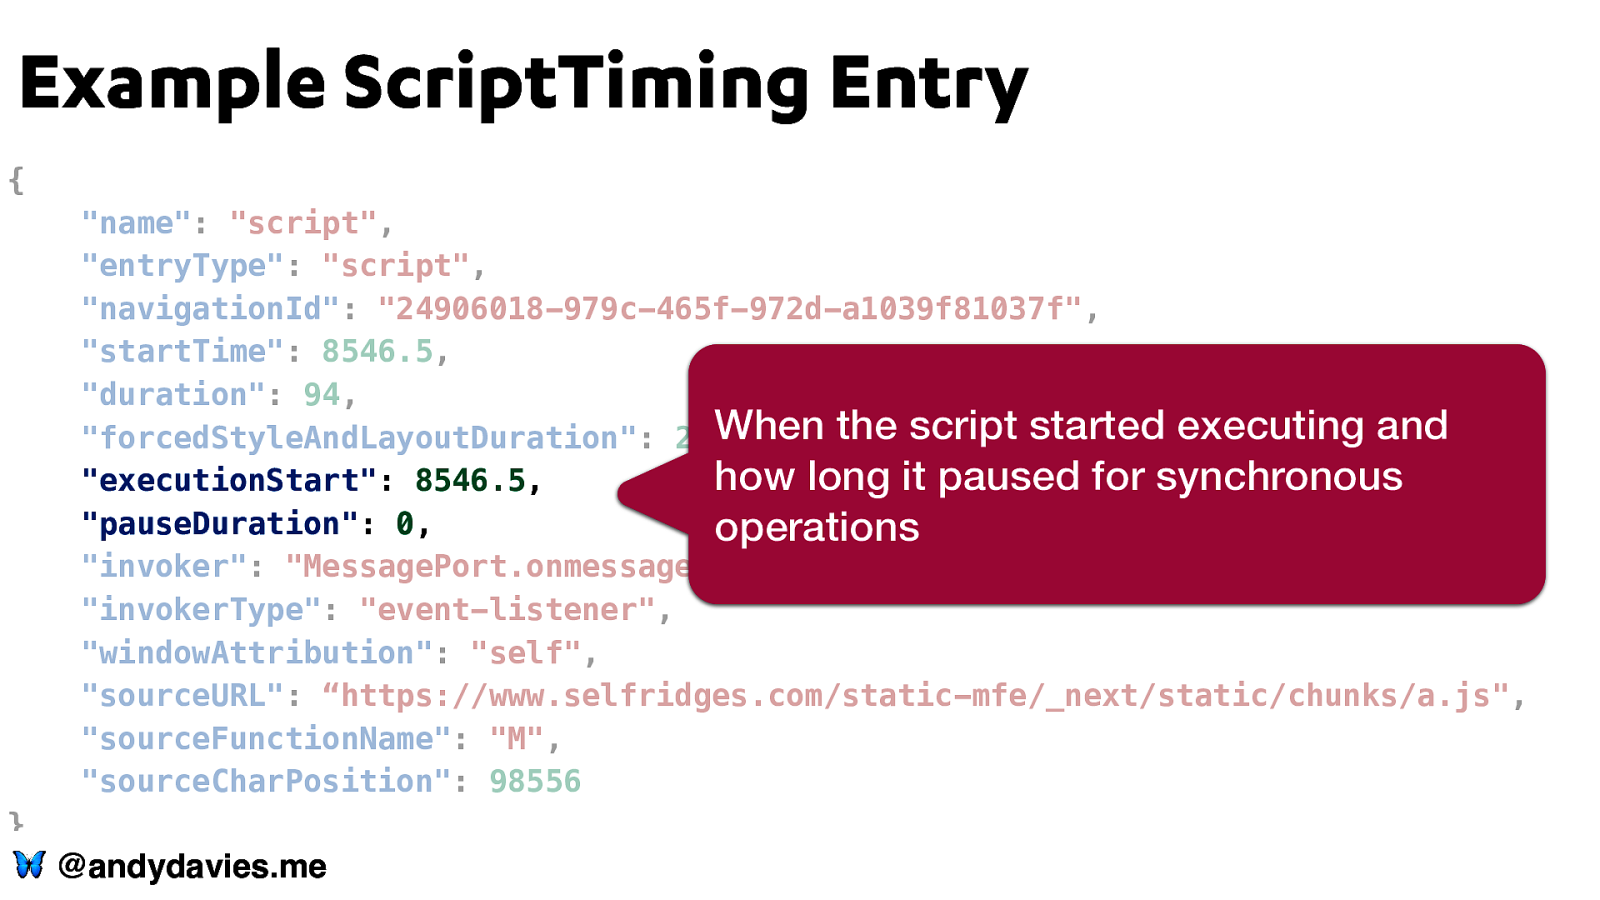
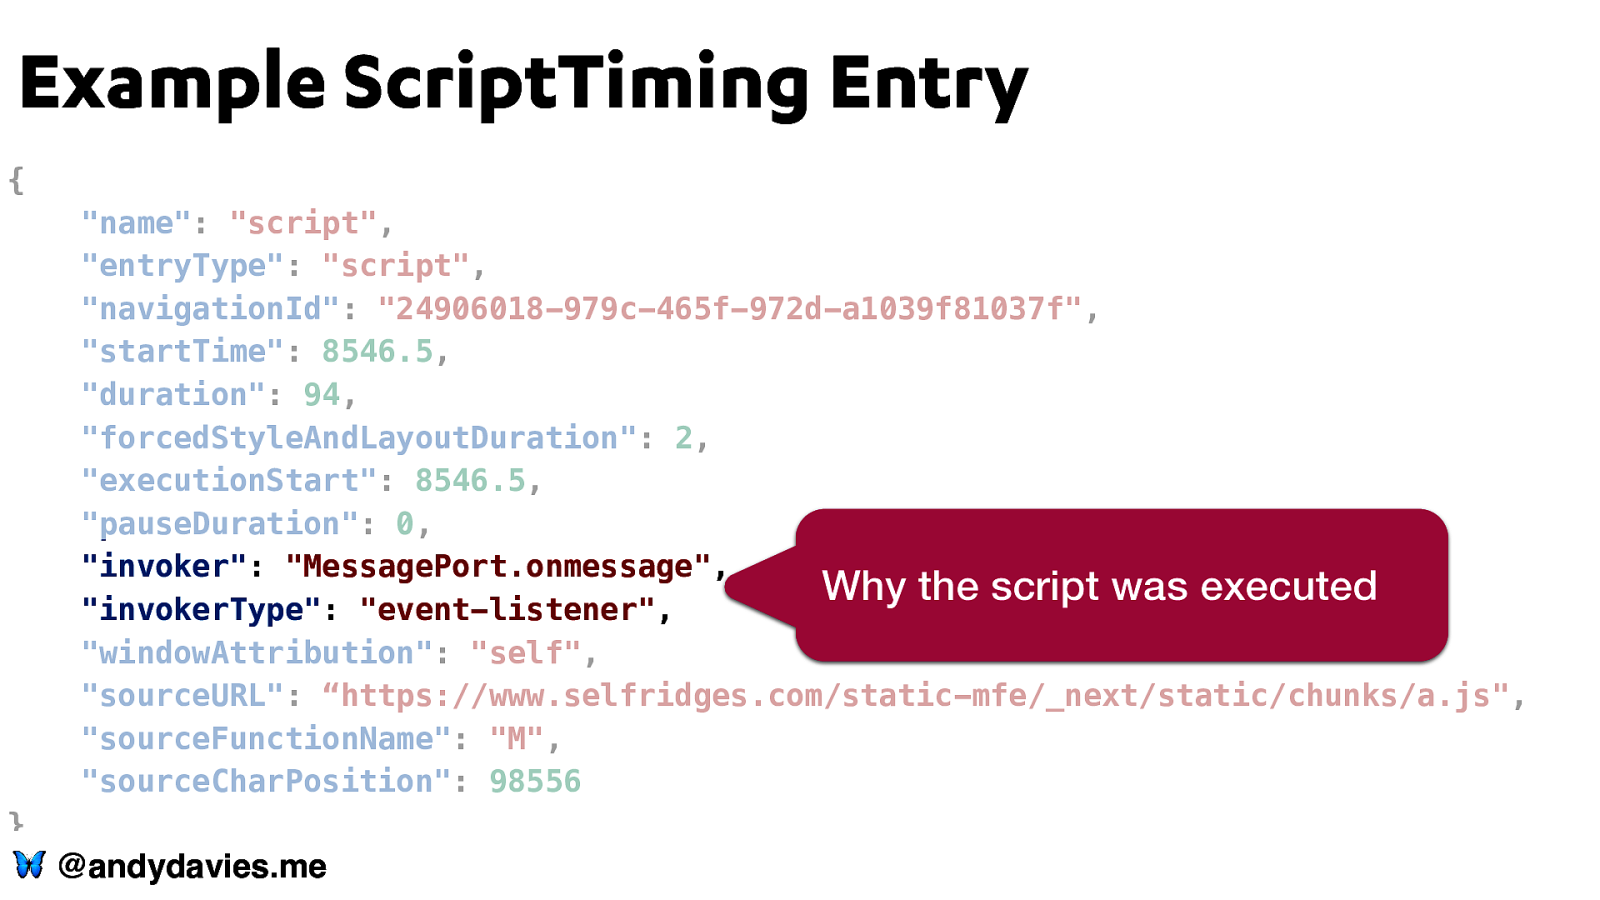
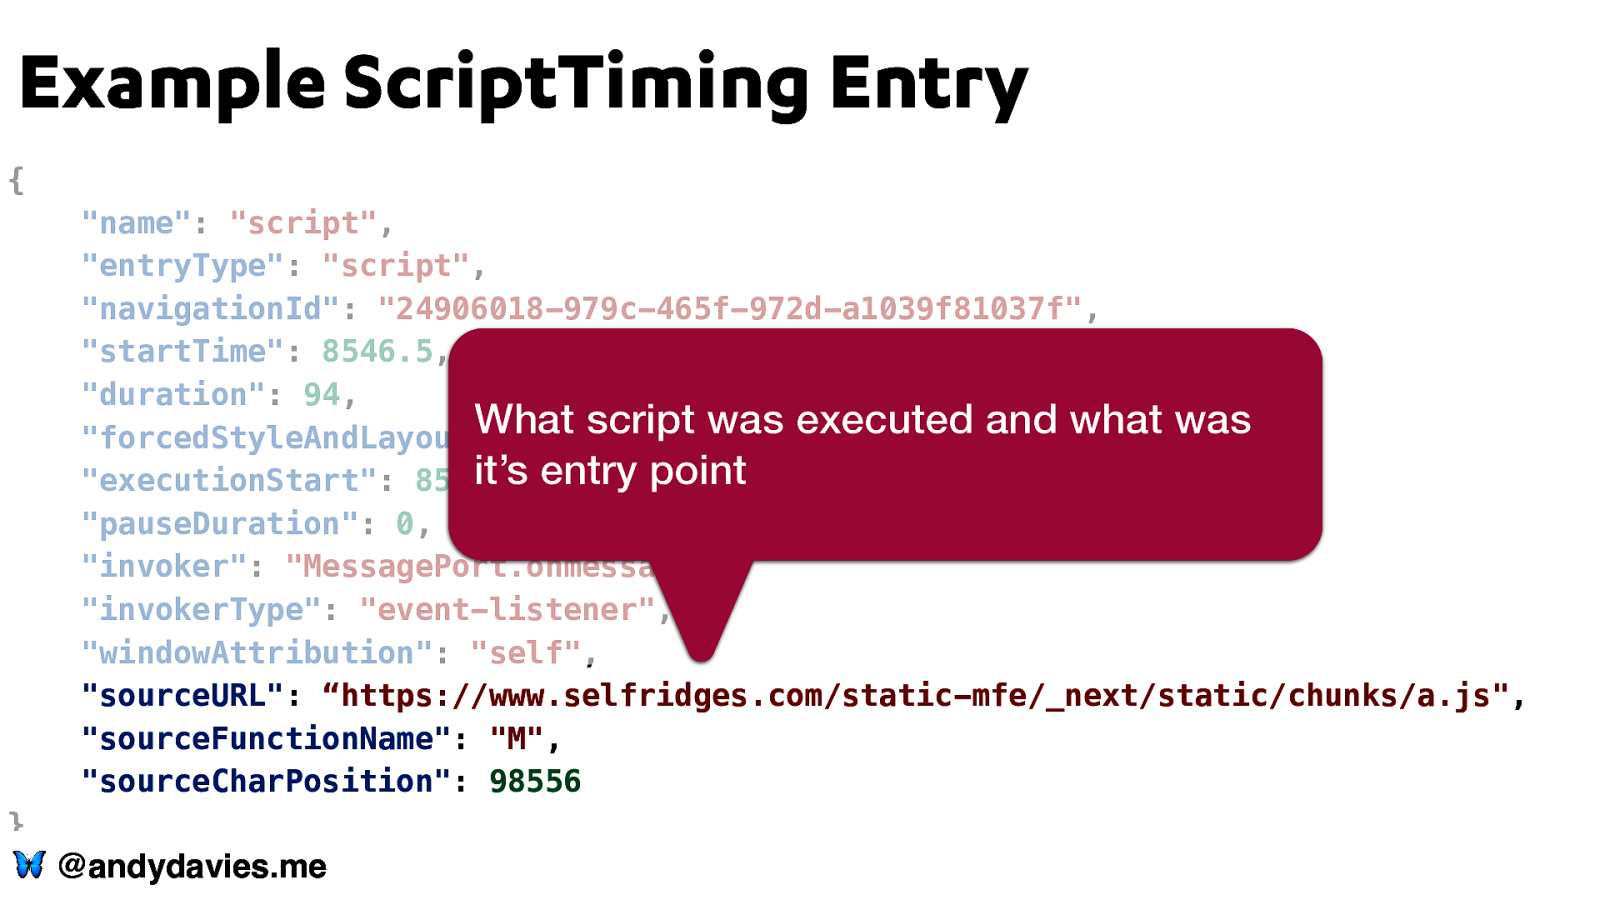
Example ScriptTiming Entry { “name”: “script”, “entryType”: “script”, “navigationId”: “24906018-979c-465f-972d-a1039f81037f”, “startTime”: 8546.5, “duration”: 94, “forcedStyleAndLayoutDuration”: 2, “executionStart”: 8546.5, “pauseDuration”: 0, “invoker”: “MessagePort.onmessage”, “invokerType”: “event-listener”, “windowAttribution”: “self”, “sourceURL”: “https://www.selfridges.com/static-mfe/_next/static/chunks/a.js”, “sourceFunctionName”: “M”, “sourceCharPosition”: 98556 } 🦋 @andydavies.me
Example ScriptTiming Entry { “name”: “script”, “entryType”: “script”, “navigationId”: “24906018-979c-465f-972d-a1039f81037f”, When the script executed, how long “startTime”: 8546.5, it executed for and whether it forced “duration”: 94, “forcedStyleAndLayoutDuration”: 2, Layout and Style calculations “executionStart”: 8546.5, “pauseDuration”: 0, “invoker”: “MessagePort.onmessage”, “invokerType”: “event-listener”, “windowAttribution”: “self”, “sourceURL”: “https://www.selfridges.com/static-mfe/_next/static/chunks/a.js”, “sourceFunctionName”: “M”, “sourceCharPosition”: 98556 } 🦋 @andydavies.me
Example ScriptTiming Entry { “name”: “script”, “entryType”: “script”, “navigationId”: “24906018-979c-465f-972d-a1039f81037f”, “startTime”: 8546.5, “duration”: 94, “forcedStyleAndLayoutDuration”: 2, When the script started executing and how long it paused for synchronous “executionStart”: 8546.5, “pauseDuration”: 0, operations “invoker”: “MessagePort.onmessage”, “invokerType”: “event-listener”, “windowAttribution”: “self”, “sourceURL”: “https://www.selfridges.com/static-mfe/_next/static/chunks/a.js”, “sourceFunctionName”: “M”, “sourceCharPosition”: 98556 } 🦋 @andydavies.me
Example ScriptTiming Entry { “name”: “script”, “entryType”: “script”, “navigationId”: “24906018-979c-465f-972d-a1039f81037f”, “startTime”: 8546.5, “duration”: 94, “forcedStyleAndLayoutDuration”: 2, “executionStart”: 8546.5, “pauseDuration”: 0, “invoker”: “MessagePort.onmessage”, Why the script was executed “invokerType”: “event-listener”, “windowAttribution”: “self”, “sourceURL”: “https://www.selfridges.com/static-mfe/_next/static/chunks/a.js”, “sourceFunctionName”: “M”, “sourceCharPosition”: 98556 } 🦋 @andydavies.me
Example ScriptTiming Entry { “name”: “script”, “entryType”: “script”, “navigationId”: “24906018-979c-465f-972d-a1039f81037f”, “startTime”: 8546.5, “duration”: 94, What script was executed and what was “forcedStyleAndLayoutDuration”: 2, it’s entry point “executionStart”: 8546.5, “pauseDuration”: 0, “invoker”: “MessagePort.onmessage”, “invokerType”: “event-listener”, “windowAttribution”: “self”, “sourceURL”: “https://www.selfridges.com/static-mfe/_next/static/chunks/a.js”, “sourceFunctionName”: “M”, “sourceCharPosition”: 98556 } 🦋 @andydavies.me
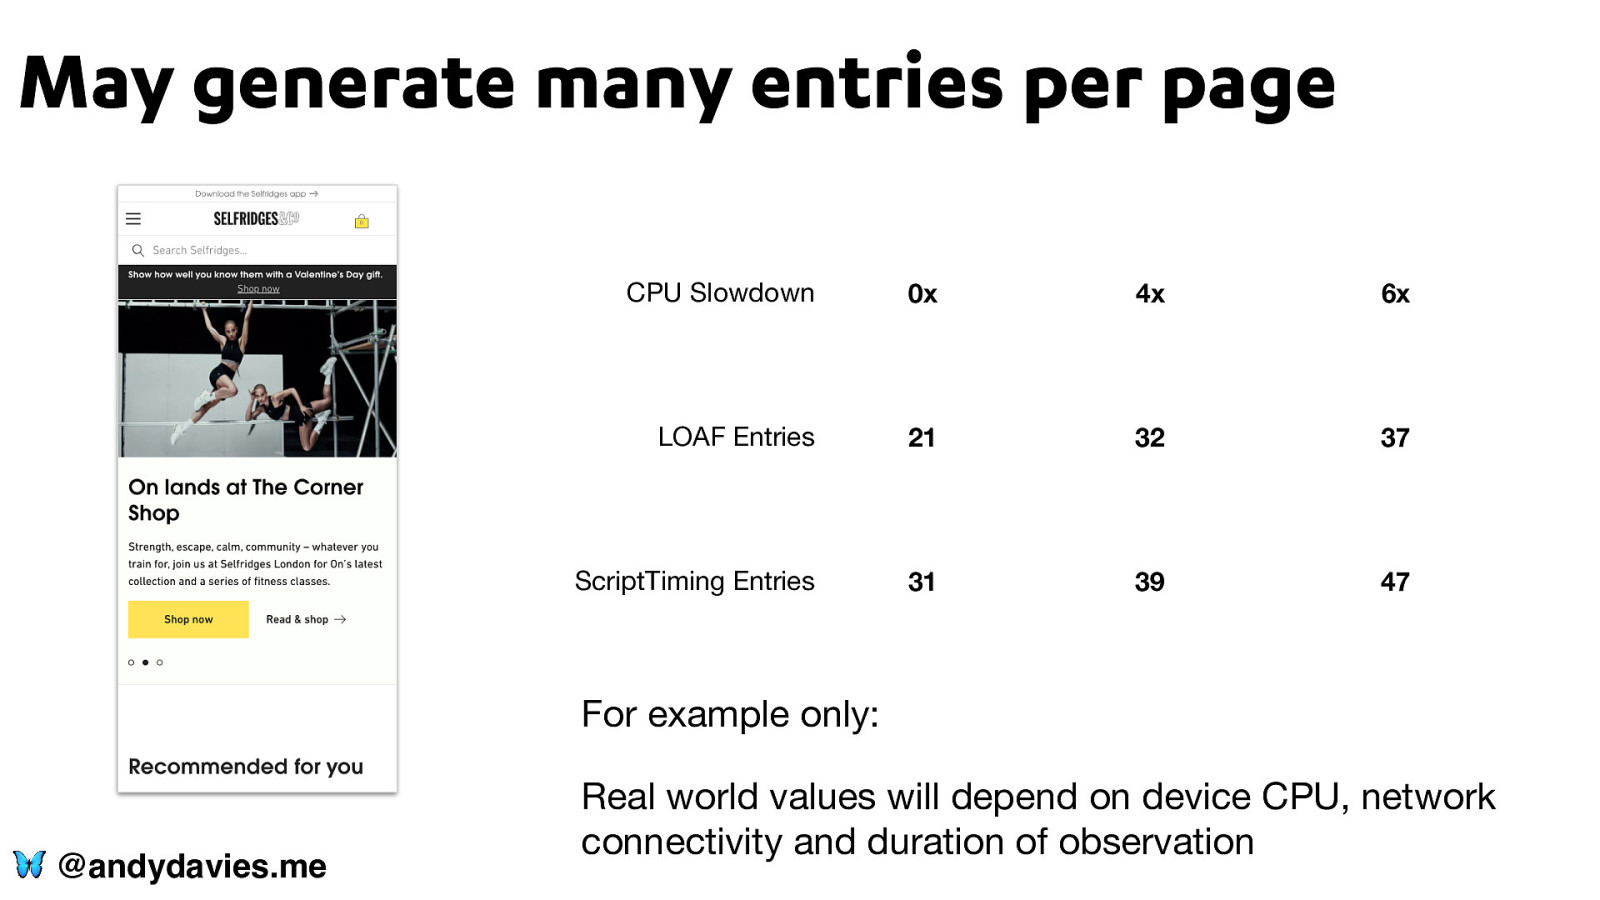
May generate many entries per page CPU Slowdown 0x 4x 6x LOAF Entries 21 32 37 ScriptTiming Entries 31 39 47 For example only: 🦋 @andydavies.me Real world values will depend on device CPU, network connectivity and duration of observation
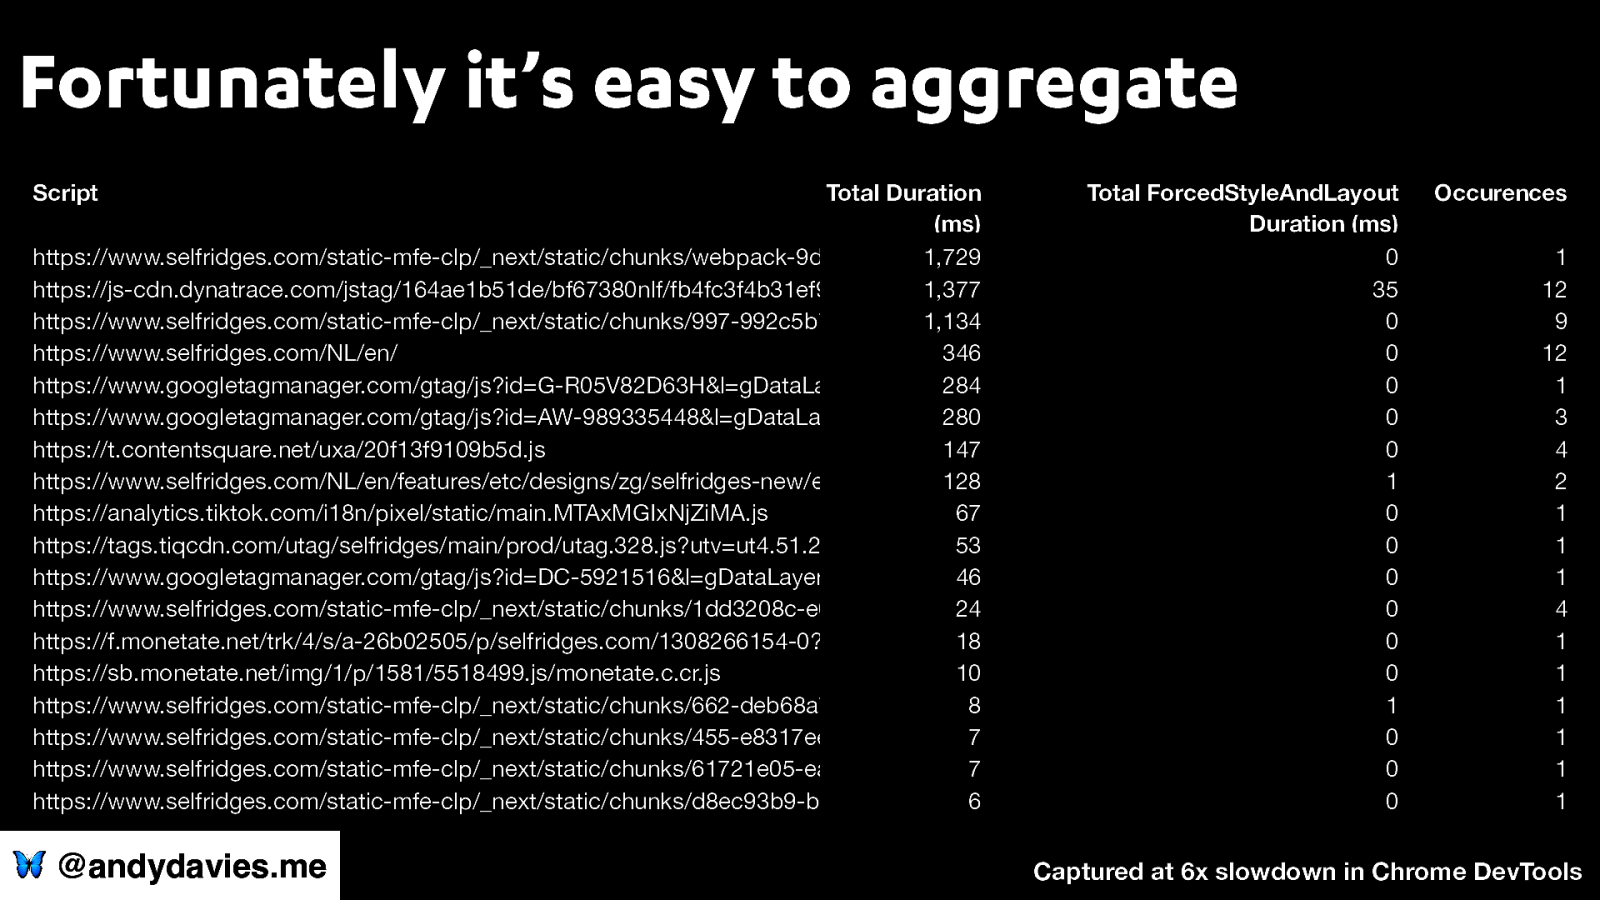
Fortunately it’s easy to aggregate Table 1 Script Total Duration Total ForcedStyleAndLayout Occurences (ms) Duration (ms) https://www.selfridges.com/cdn-cgi/challenge-platform/h/g/scripts/jsd/dc9b2fe37153/main.js? 4041 7 1 https://www.selfridges.com/static-mfe-clp/_next/static/chunks/webpack-9d1188ae22b98fe3.js 1,729 0 1 https://js-cdn.dynatrace.com/jstag/164ae1b51de/bf67380nlf/fb4fc3f4b31ef9b_complete.js 1,377 35 12 https://www.selfridges.com/static-mfe-clp/_next/static/chunks/997-992c5b7209104721.js 1,134 0 9 https://www.selfridges.com/NL/en/ 346 0 12 https://www.googletagmanager.com/gtag/js?id=G-R05V82D63H&l=gDataLayer&cx=c>m=45fe51n0v9135074567za200 284 0 1 https://www.googletagmanager.com/gtag/js?id=AW-989335448&l=gDataLayer&cx=c>m=45fe51n0v9135074567za200 280 0 3 https://t.contentsquare.net/uxa/20f13f9109b5d.js 147 0 4 https://www.selfridges.com/NL/en/features/etc/designs/zg/selfridges-new/expose-react.js 128 1 2 https://analytics.tiktok.com/i18n/pixel/static/main.MTAxMGIxNjZiMA.js 67 0 1 https://tags.tiqcdn.com/utag/selfridges/main/prod/utag.328.js?utv=ut4.51.20211019083653 0 1 https://www.googletagmanager.com/gtag/js?id=DC-5921516&l=gDataLayer 46 0 1 https://www.selfridges.com/static-mfe-clp/_next/static/chunks/1dd3208c-e00c76a8442c24a8.js 0 4 https://f.monetate.net/trk/4/s/a-26b02505/p/selfridges.com/1308266154-0?mr=t1640009934&mi=%272.1452019399.1731666309291%27&cs=!t&e=!(v 18 0 1 https://sb.monetate.net/img/1/p/1581/5518499.js/monetate.c.cr.js 10 0 1 https://www.selfridges.com/static-mfe-clp/_next/static/chunks/662-deb68a78ee042d82.js8 1 1 https://www.selfridges.com/static-mfe-clp/_next/static/chunks/455-e8317ee897e635e1.js7 0 1 https://www.selfridges.com/static-mfe-clp/_next/static/chunks/61721e05-eae8ee308776ce08.js 7 0 1 https://www.selfridges.com/static-mfe-clp/_next/static/chunks/d8ec93b9-b055f6911e75df94.js 6 0 1 🦋 @andydavies.me ff Captured at 6x slowdown in Chrome DevTools
Can help us answer questions such as • Which scripts have the most impact on visitors experience? • Which scripts are forcing style and layout operations? • Which scripts delay FCP or LCP? • Are my 1st Party or 3rd-party scripts a problem? 🦋 @andydavies.me
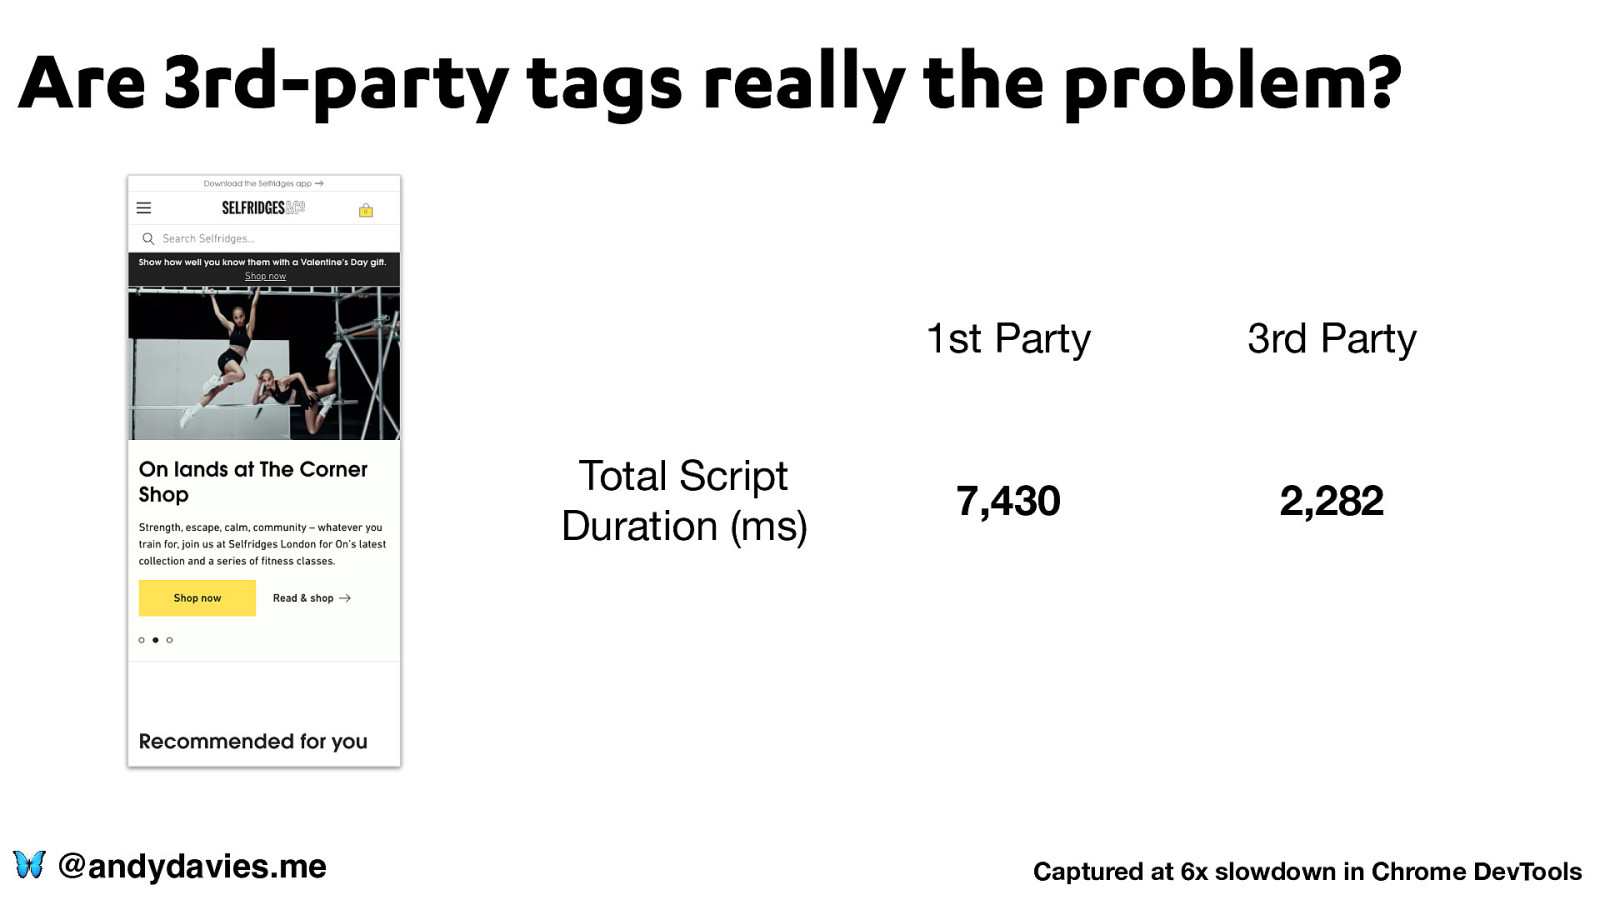
Are 3rd-party tags really the problem? Total Script Duration (ms) 🦋 @andydavies.me 1st Party 3rd Party 7,430 2,282 Captured at 6x slowdown in Chrome DevTools
LoAF can help with slow interactions too 🦋 @andydavies.me Photo by Nik on Unsplash
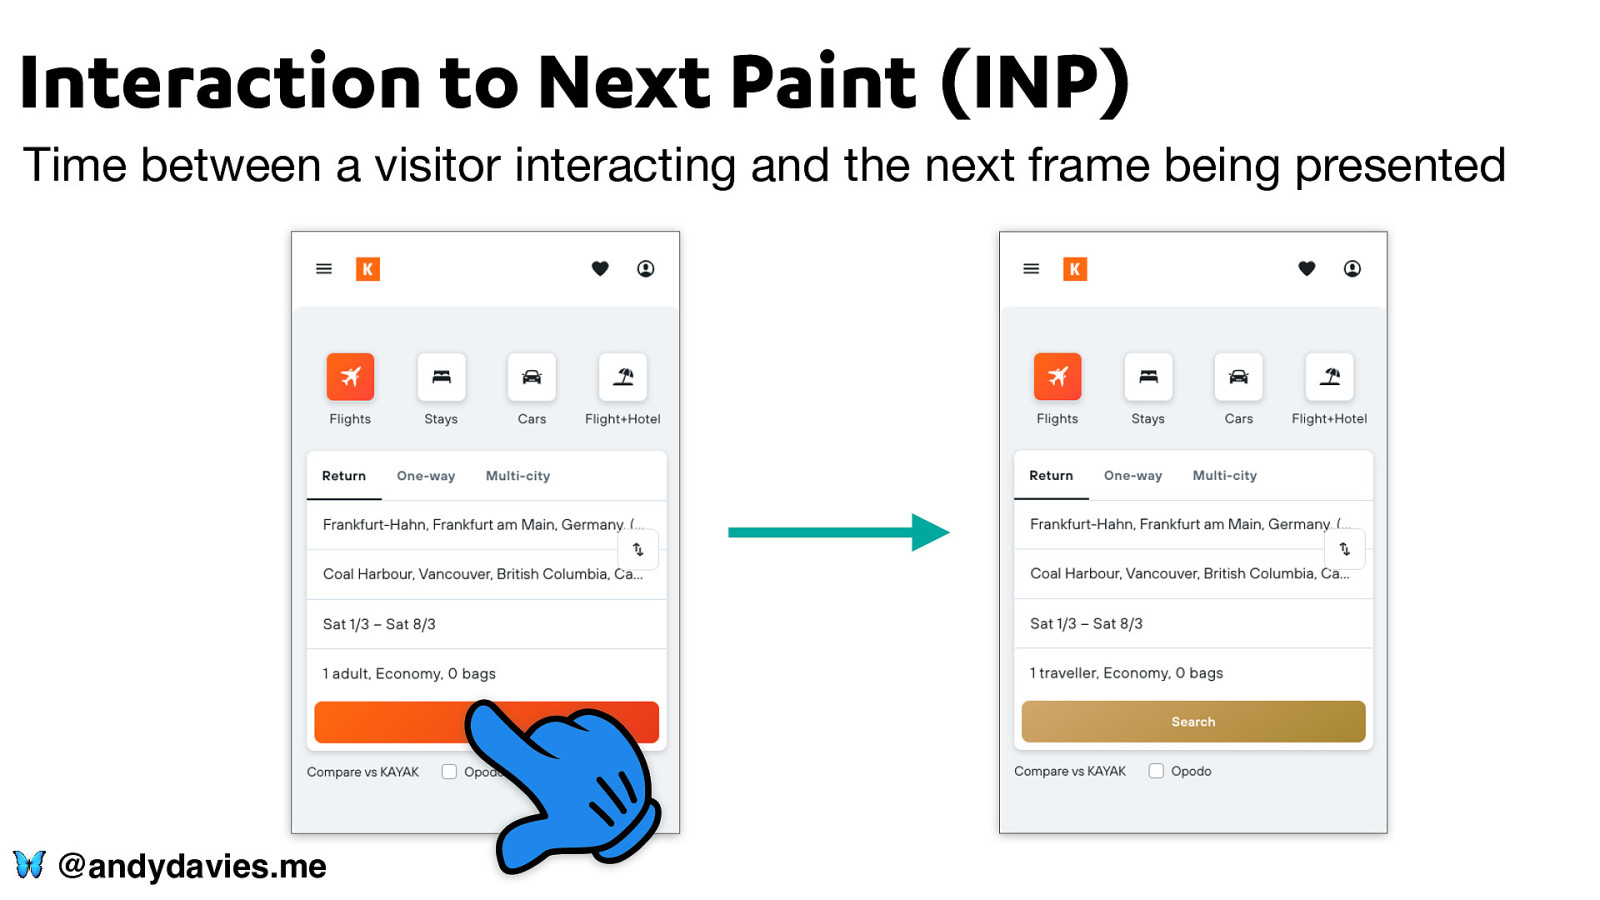
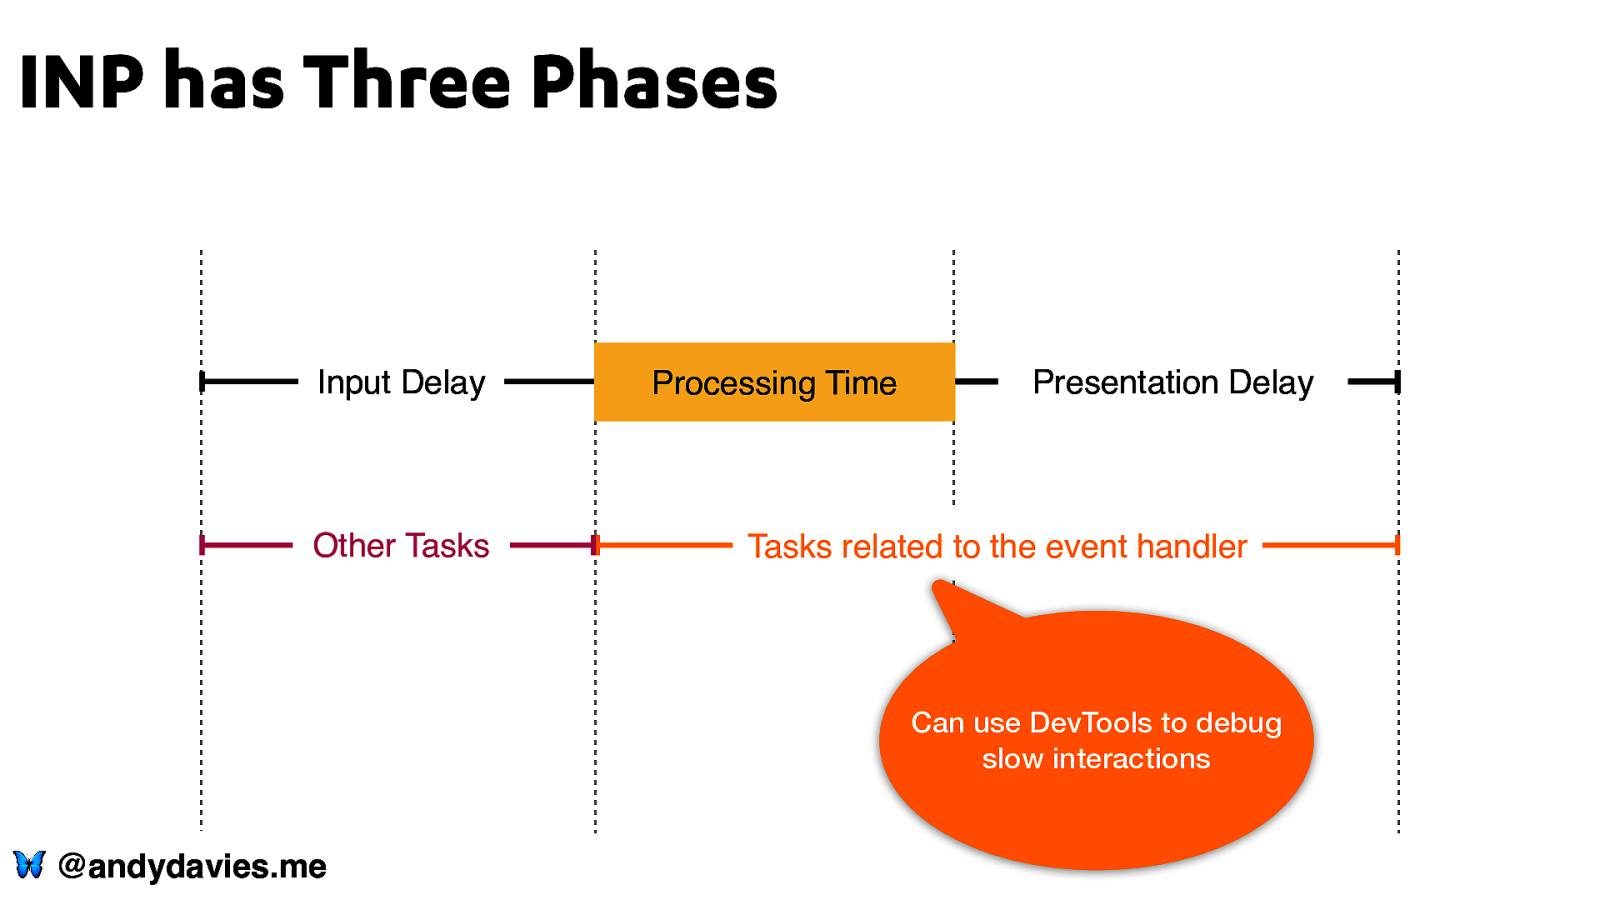
Interaction to Next Paint (INP) Time between a visitor interacting and the next frame being presented 🦋 @andydavies.me
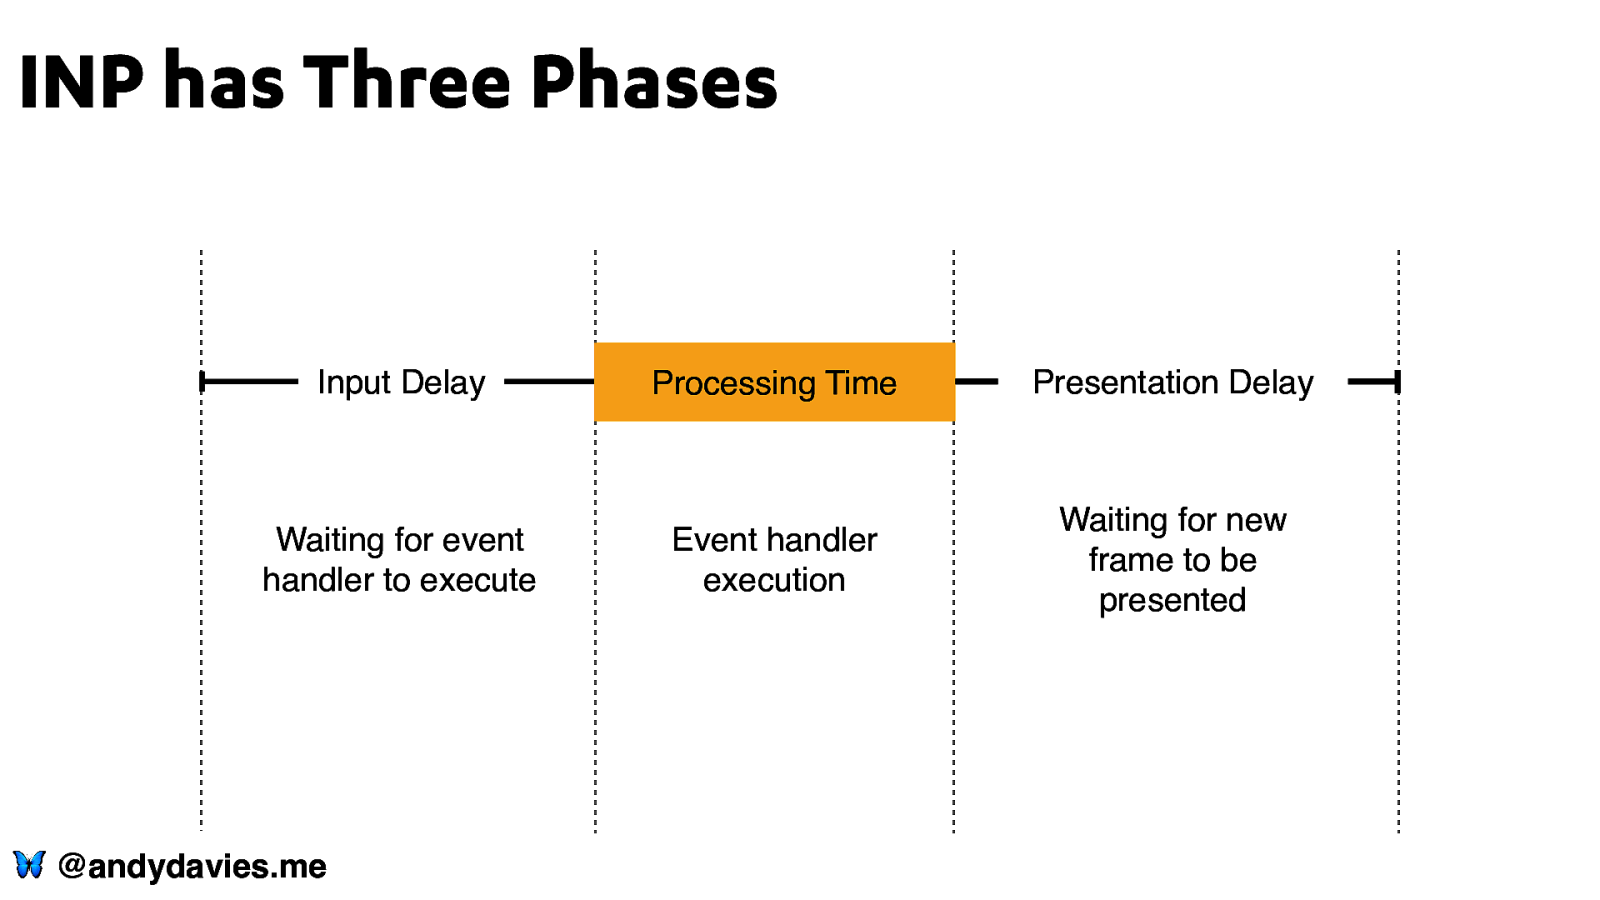
INP has Three Phases Input Delay Waiting for event handler to execute 🦋 @andydavies.me Processing Time Presentation Delay Event handler execution Waiting for new frame to be presented
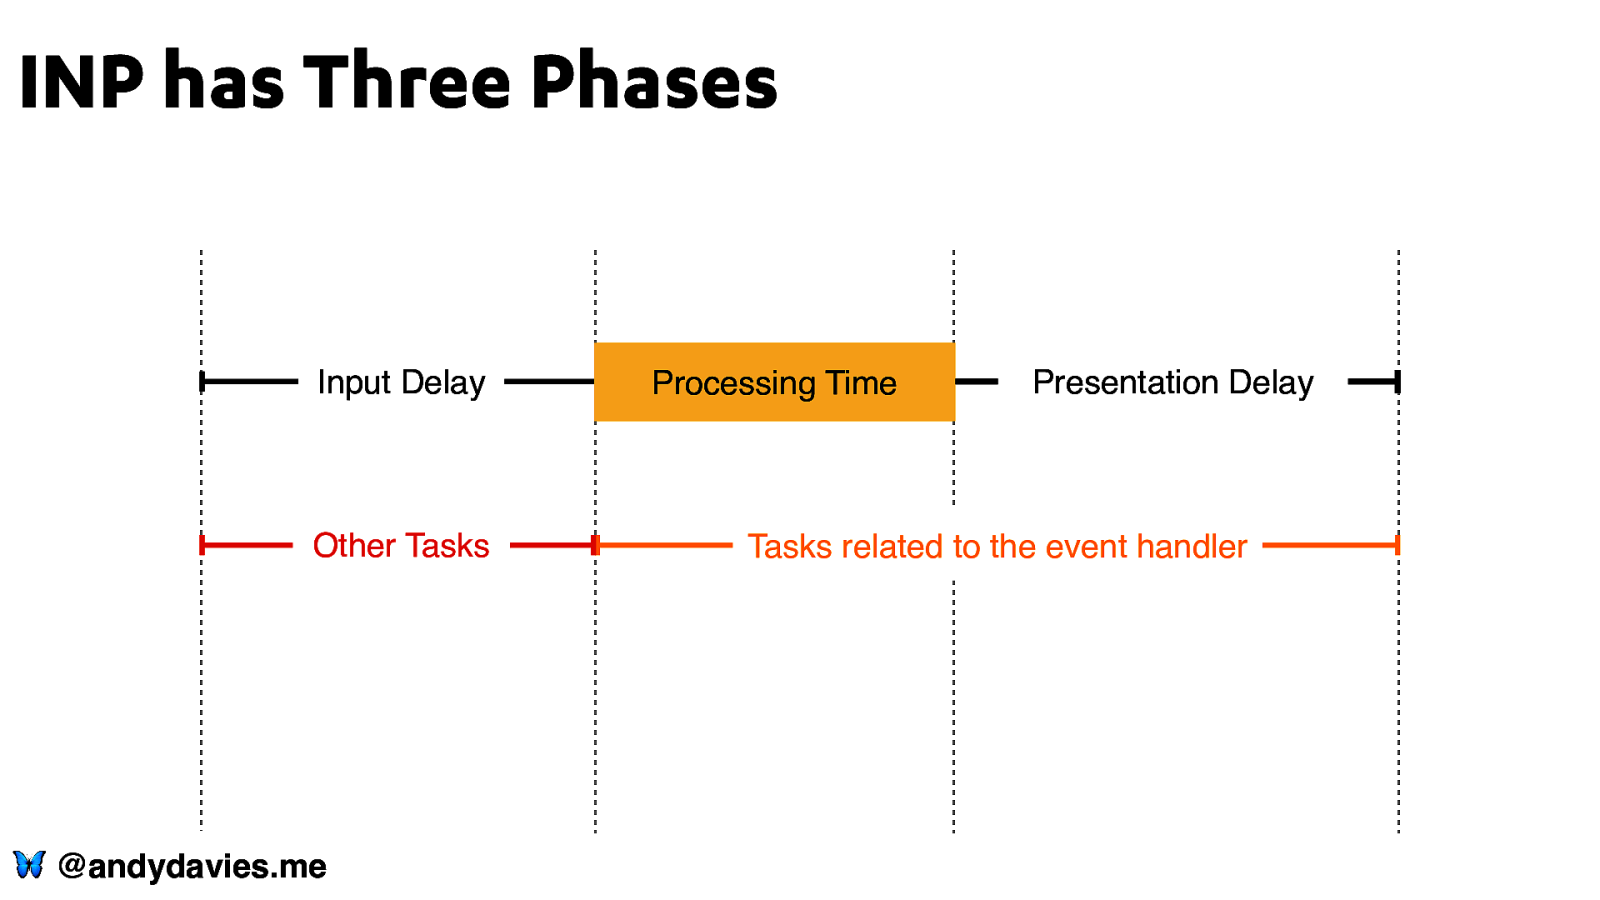
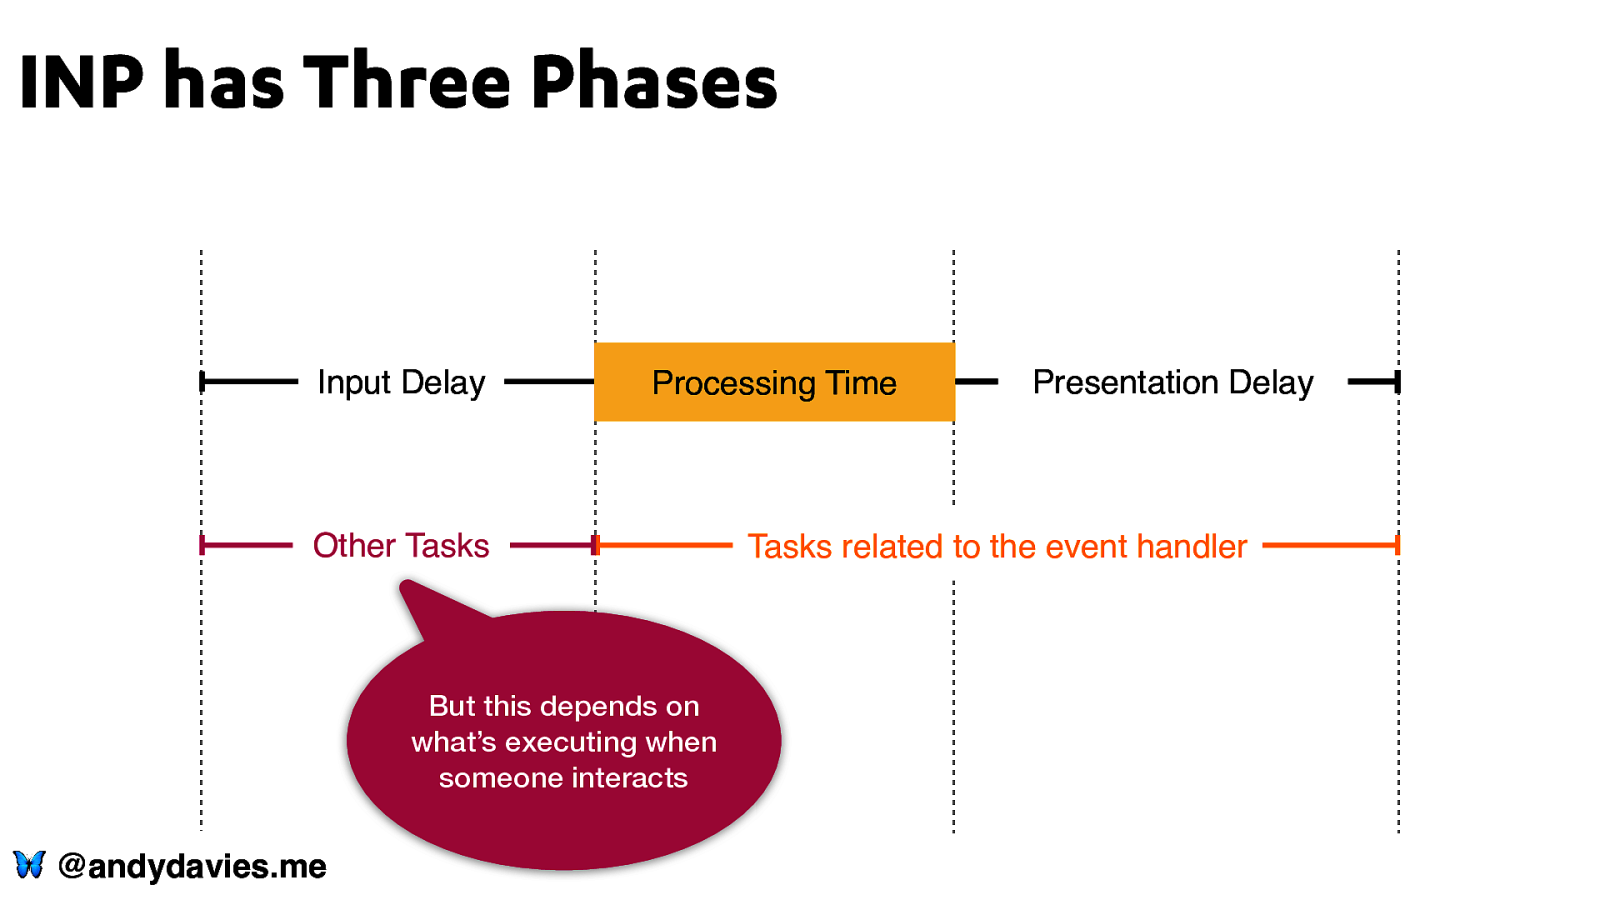
INP has Three Phases Input Delay Other Tasks 🦋 @andydavies.me Processing Time Presentation Delay Tasks related to the event handler
INP has Three Phases Input Delay Other Tasks Processing Time Presentation Delay Tasks related to the event handler Can use DevTools to debug slow interactions 🦋 @andydavies.me
INP has Three Phases Input Delay Processing Time Other Tasks But this depends on what’s executing when someone interacts 🦋 @andydavies.me Presentation Delay Tasks related to the event handler
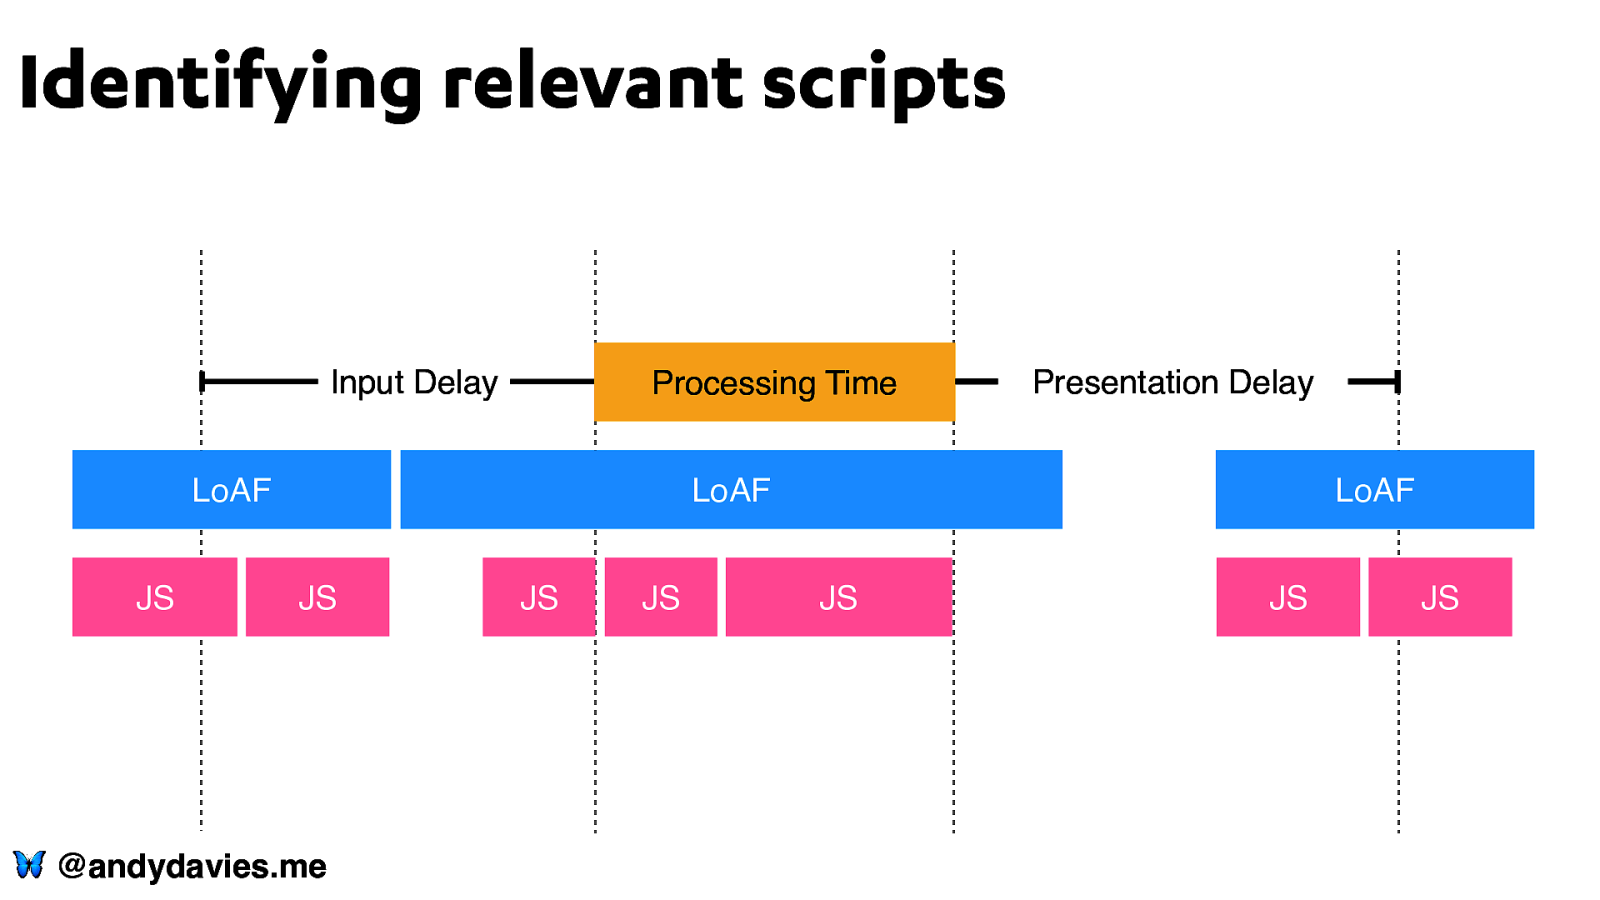
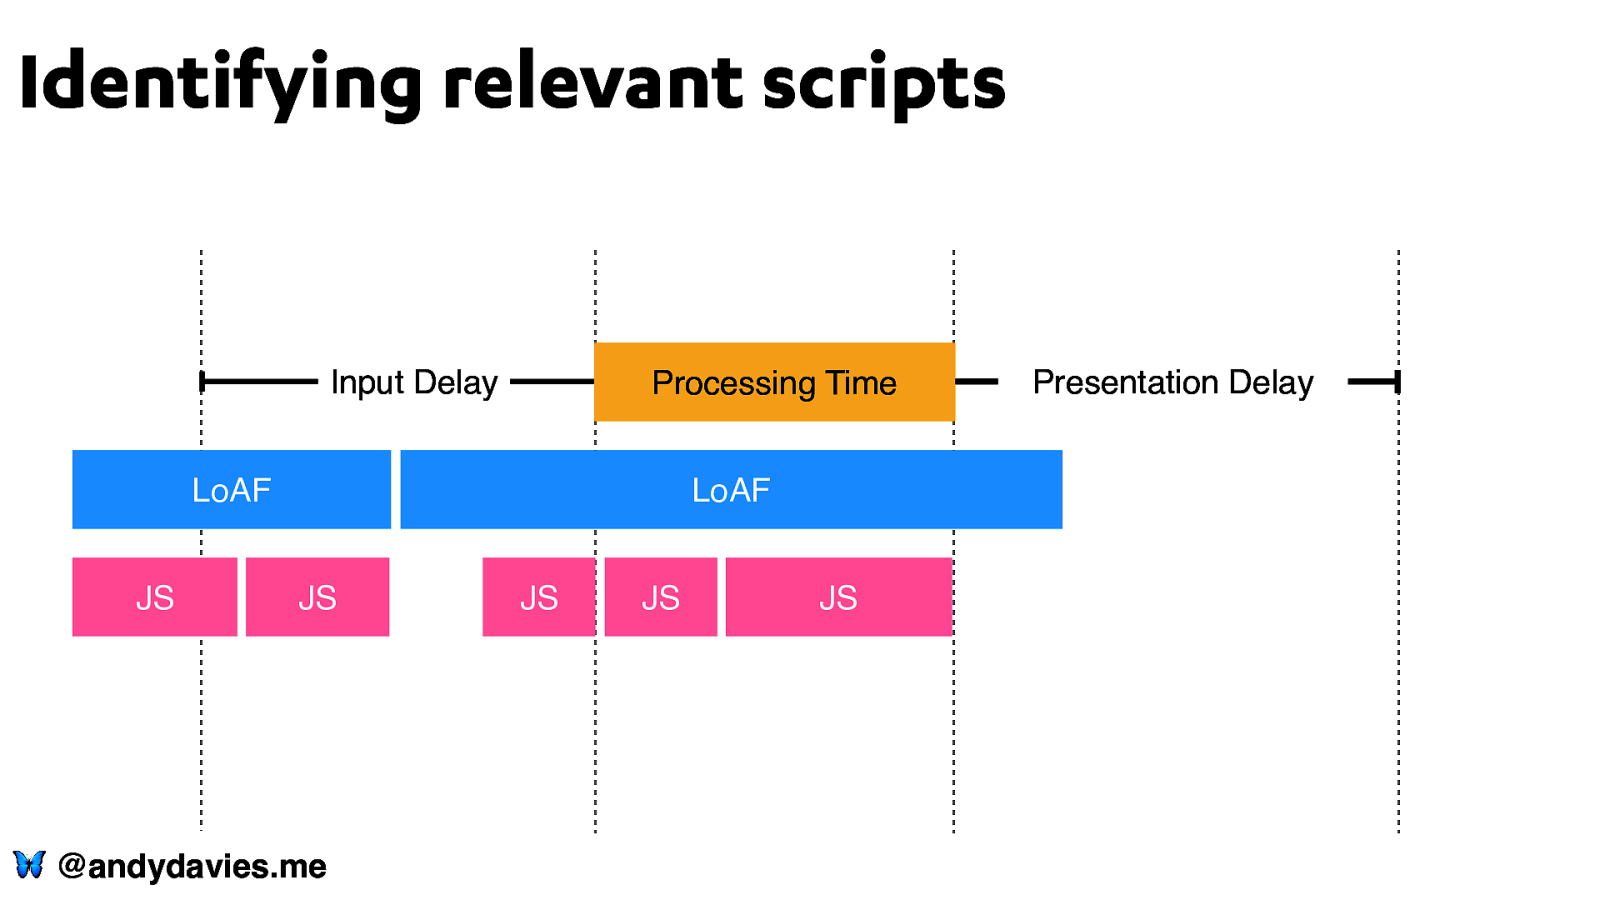
Identifying relevant scripts Input Delay Processing Time LoAF JS Presentation Delay LoAF JS 🦋 @andydavies.me JS JS LoAF JS JS JS
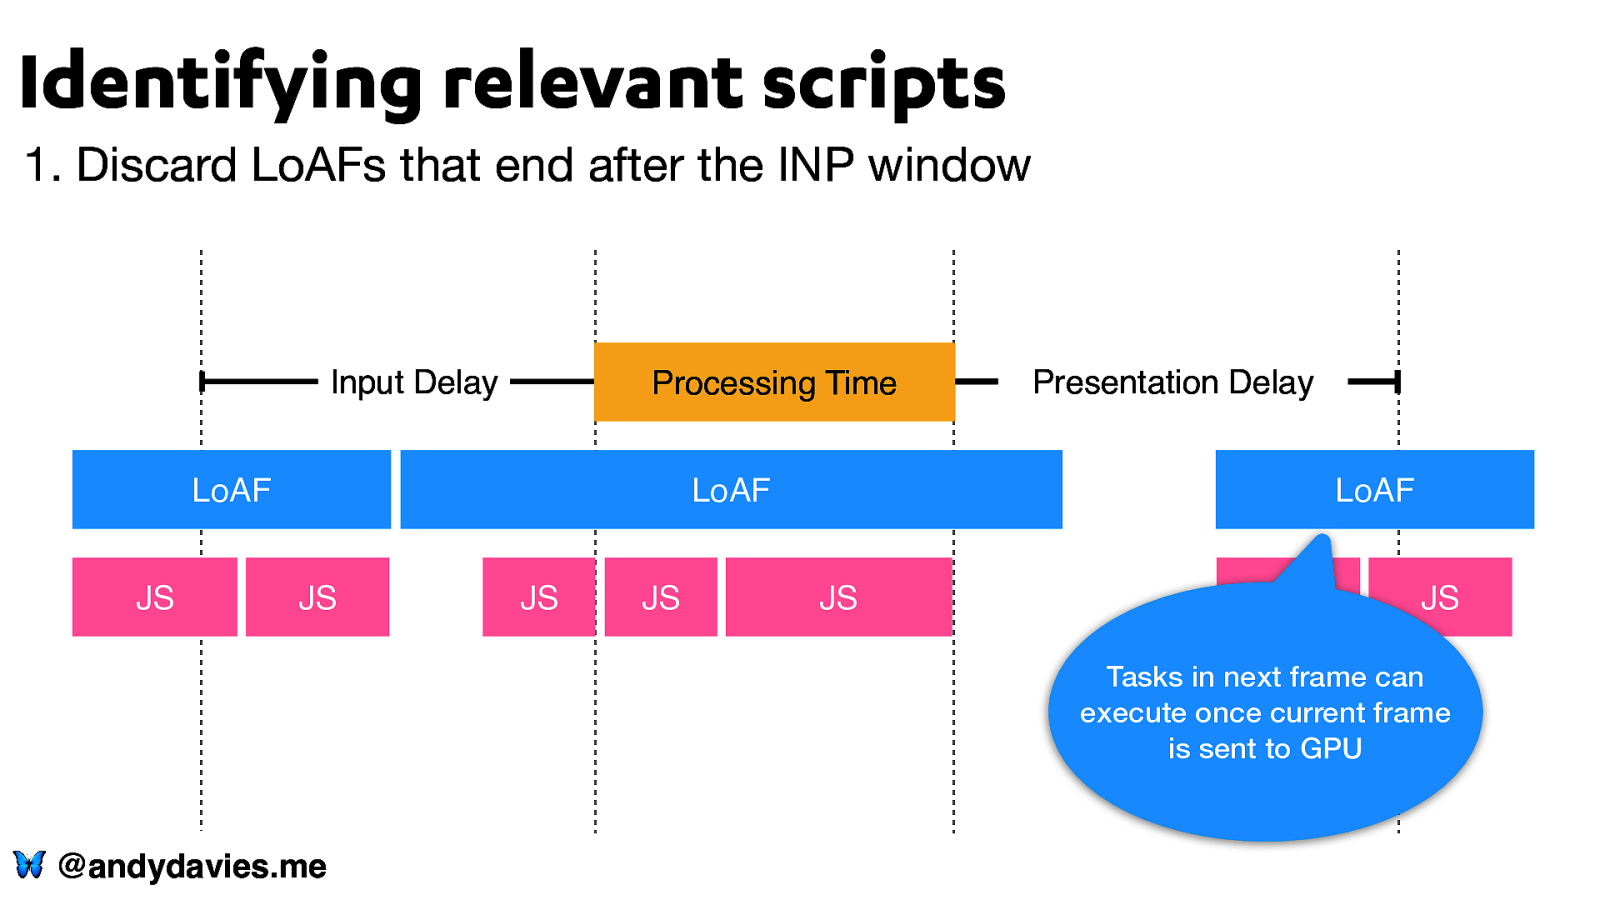
Identifying relevant scripts 1. Discard LoAFs that end after the INP window Input Delay Processing Time LoAF JS Presentation Delay LoAF JS JS JS LoAF JS JS JS Tasks in next frame can execute once current frame is sent to GPU 🦋 @andydavies.me
Identifying relevant scripts Input Delay Processing Time LoAF JS LoAF JS 🦋 @andydavies.me JS JS JS Presentation Delay
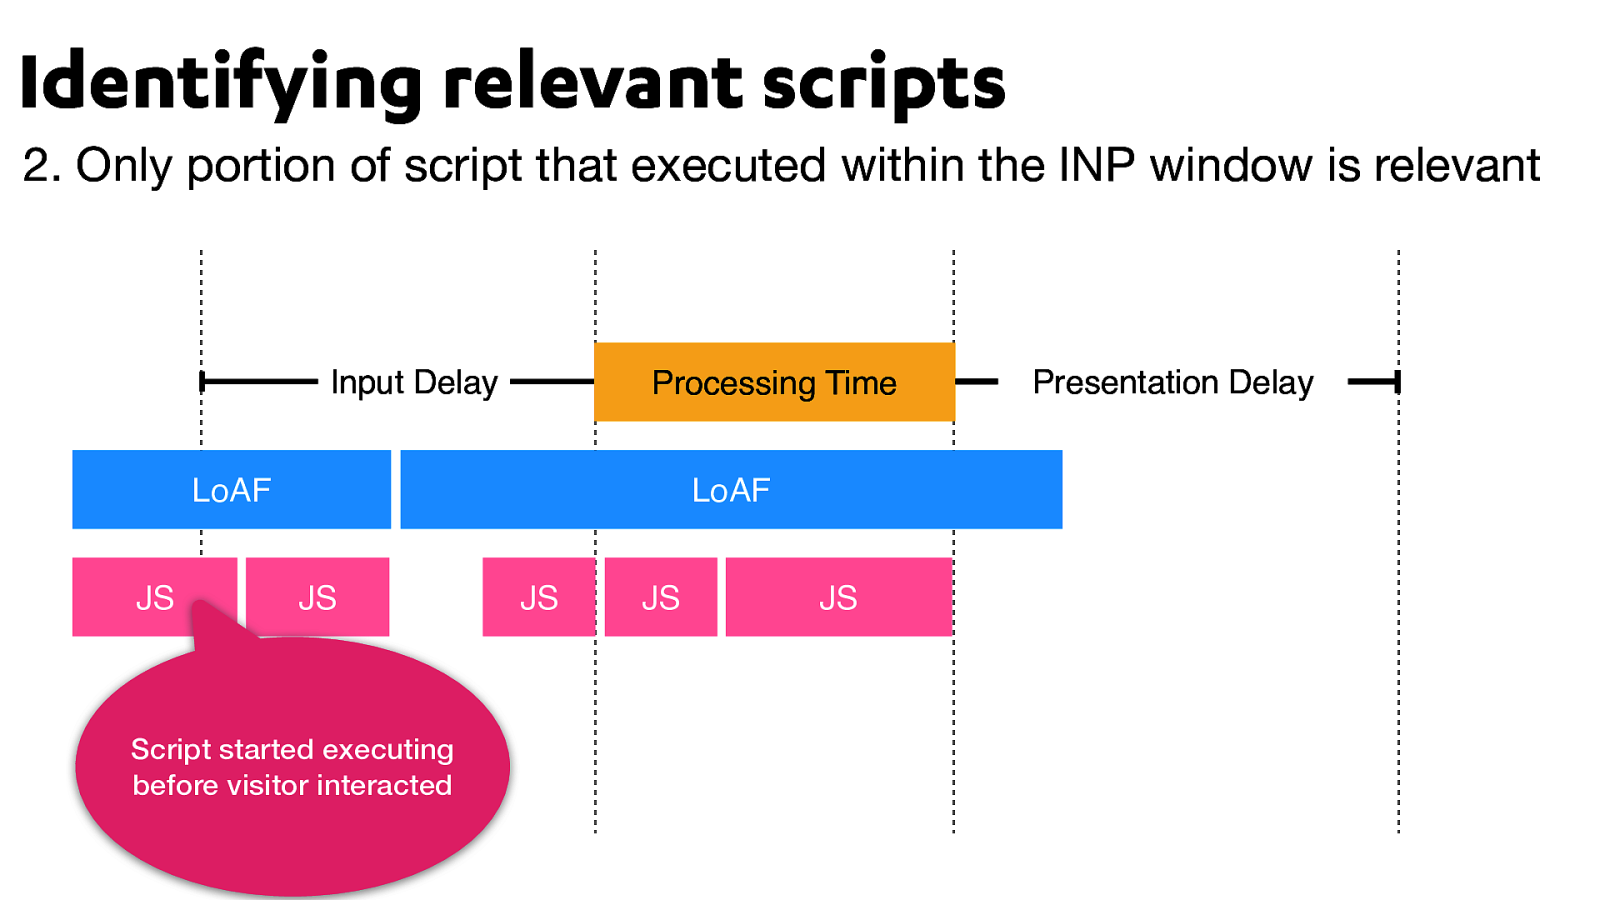
Identifying relevant scripts 2. Only portion of script that executed within the INP window is relevant Input Delay Processing Time LoAF JS LoAF JS Script started executing before visitor interacted JS JS JS Presentation Delay
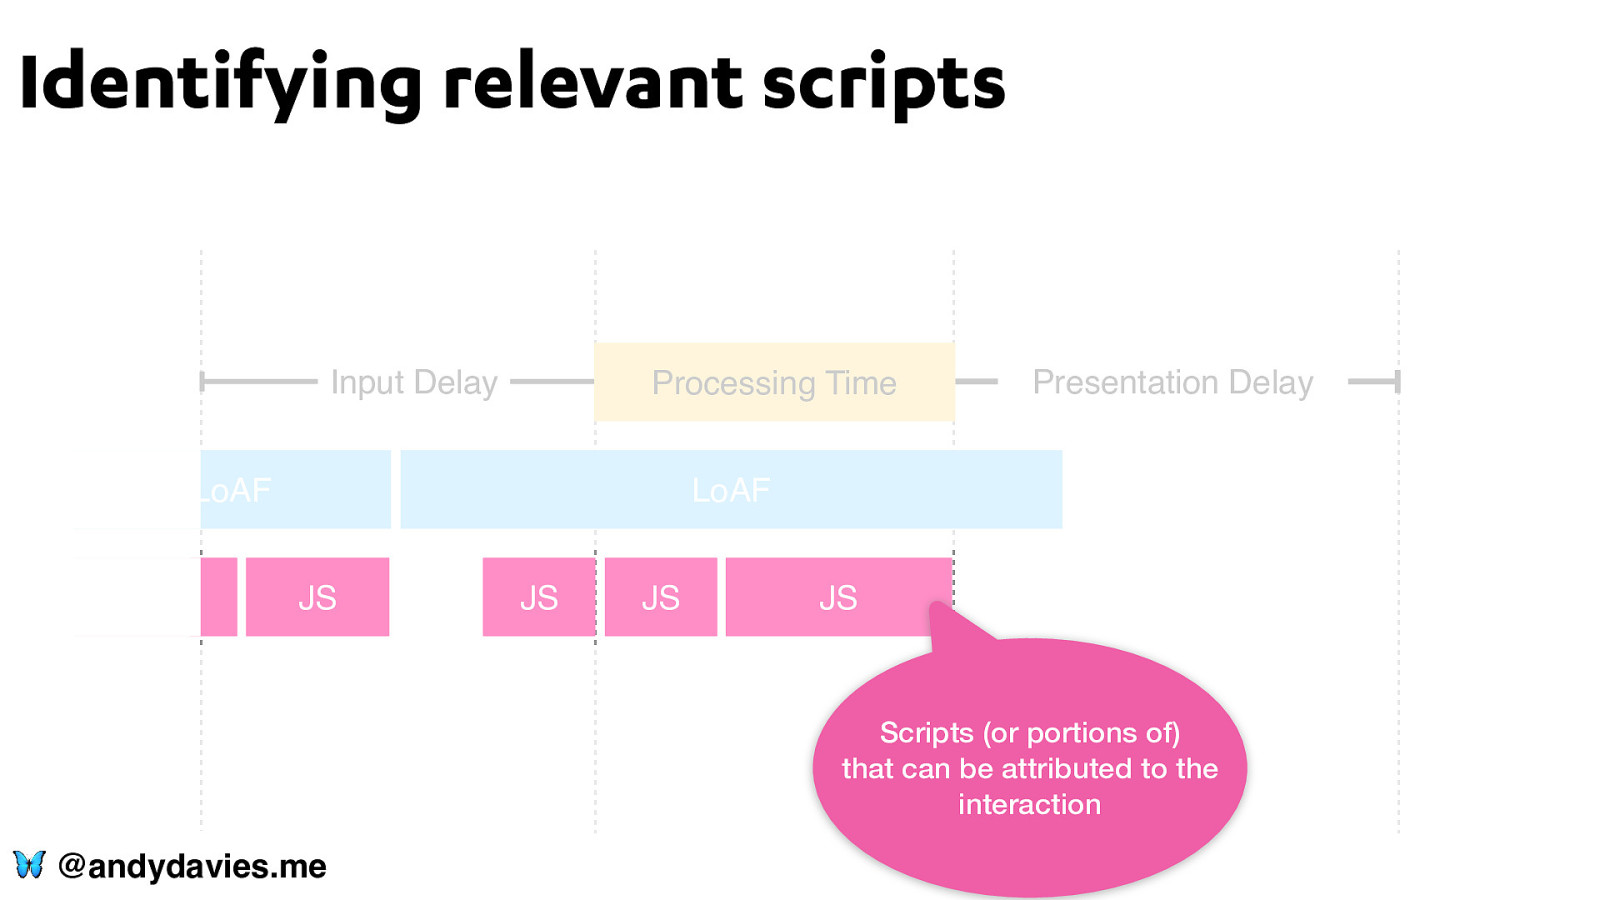
Identifying relevant scripts Input Delay JS JSJS Processing Time LoAF Presentation Delay LoAF JS JS JS JS Scripts (or portions of) that can be attributed to the interaction 🦋 @andydavies.me
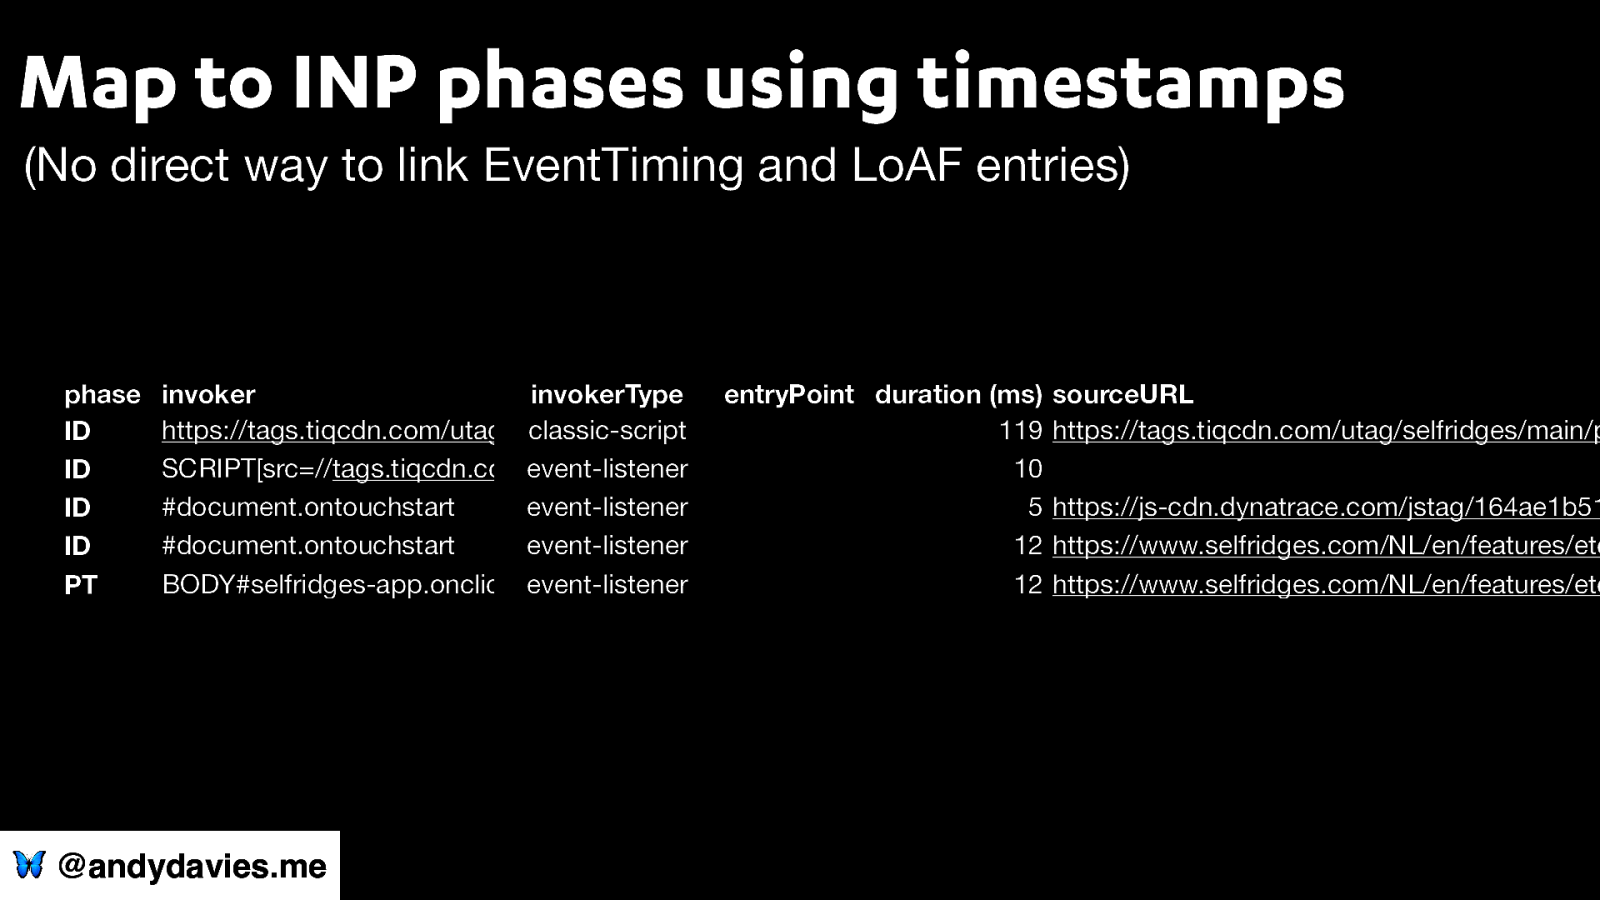
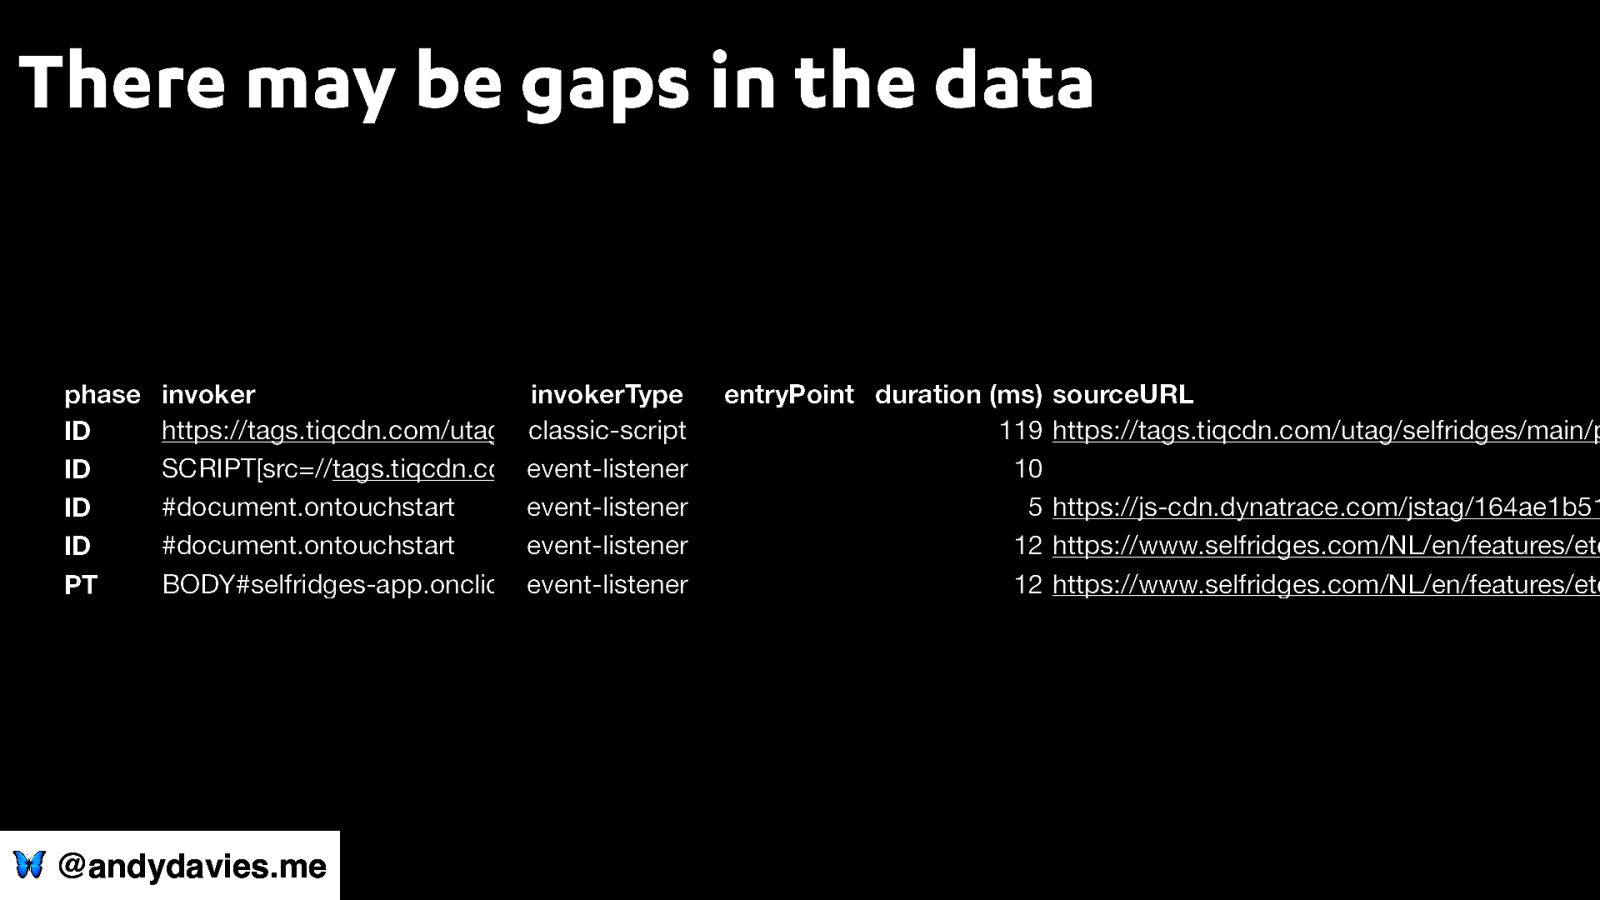
Map to INP phases using timestamps (No direct way to link EventTiming and LoAF entries) Table 1 phase ID ID ID ID PT invoker invokerType entryPoint duration (ms) https://tags.tiqcdn.com/utag/selfridges/main/prod/utag.js classic-script 119 SCRIPT[src=//tags.tiqcdn.com/utag/selfridges/main/prod/utag.js].onload event-listener 10 #document.ontouchstart event-listener 5 #document.ontouchstart event-listener 12 BODY#selfridges-app.onclick event-listener 12 🦋 @andydavies.me sourceURL https://tags.tiqcdn.com/utag/selfridges/main/p https://js-cdn.dynatrace.com/jstag/164ae1b51 https://www.selfridges.com/NL/en/features/etc https://www.selfridges.com/NL/en/features/etc
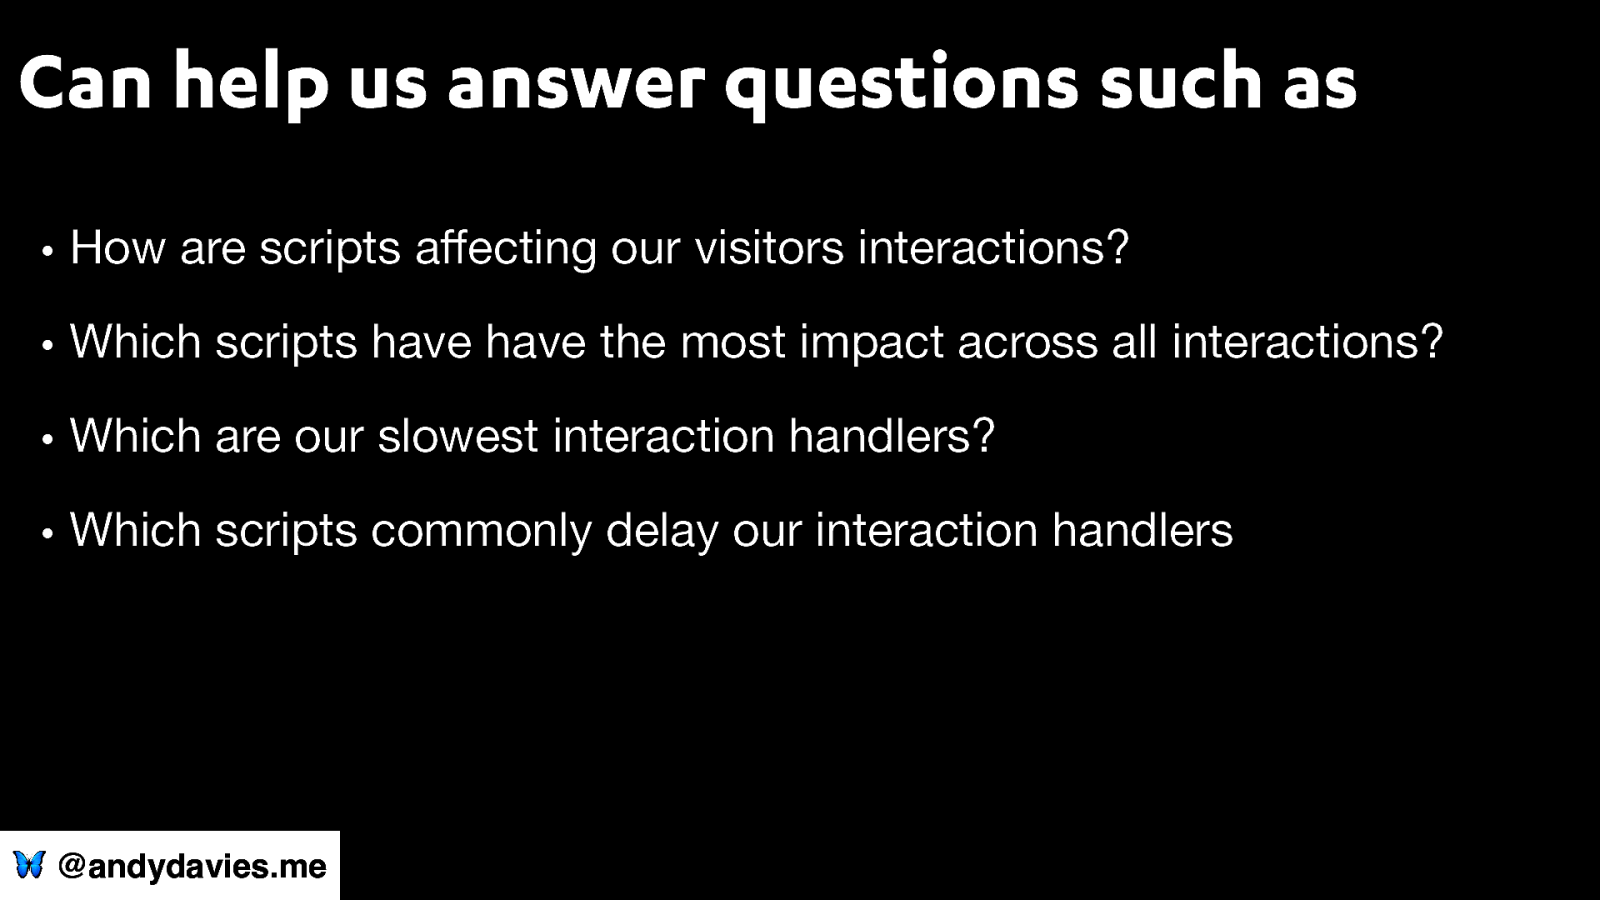
Can help us answer questions such as • How are scripts a ecting our visitors interactions? • Which scripts have have the most impact across all interactions? • Which are our slowest interaction handlers? • Which scripts commonly delay our interaction handlers ff 🦋 @andydavies.me
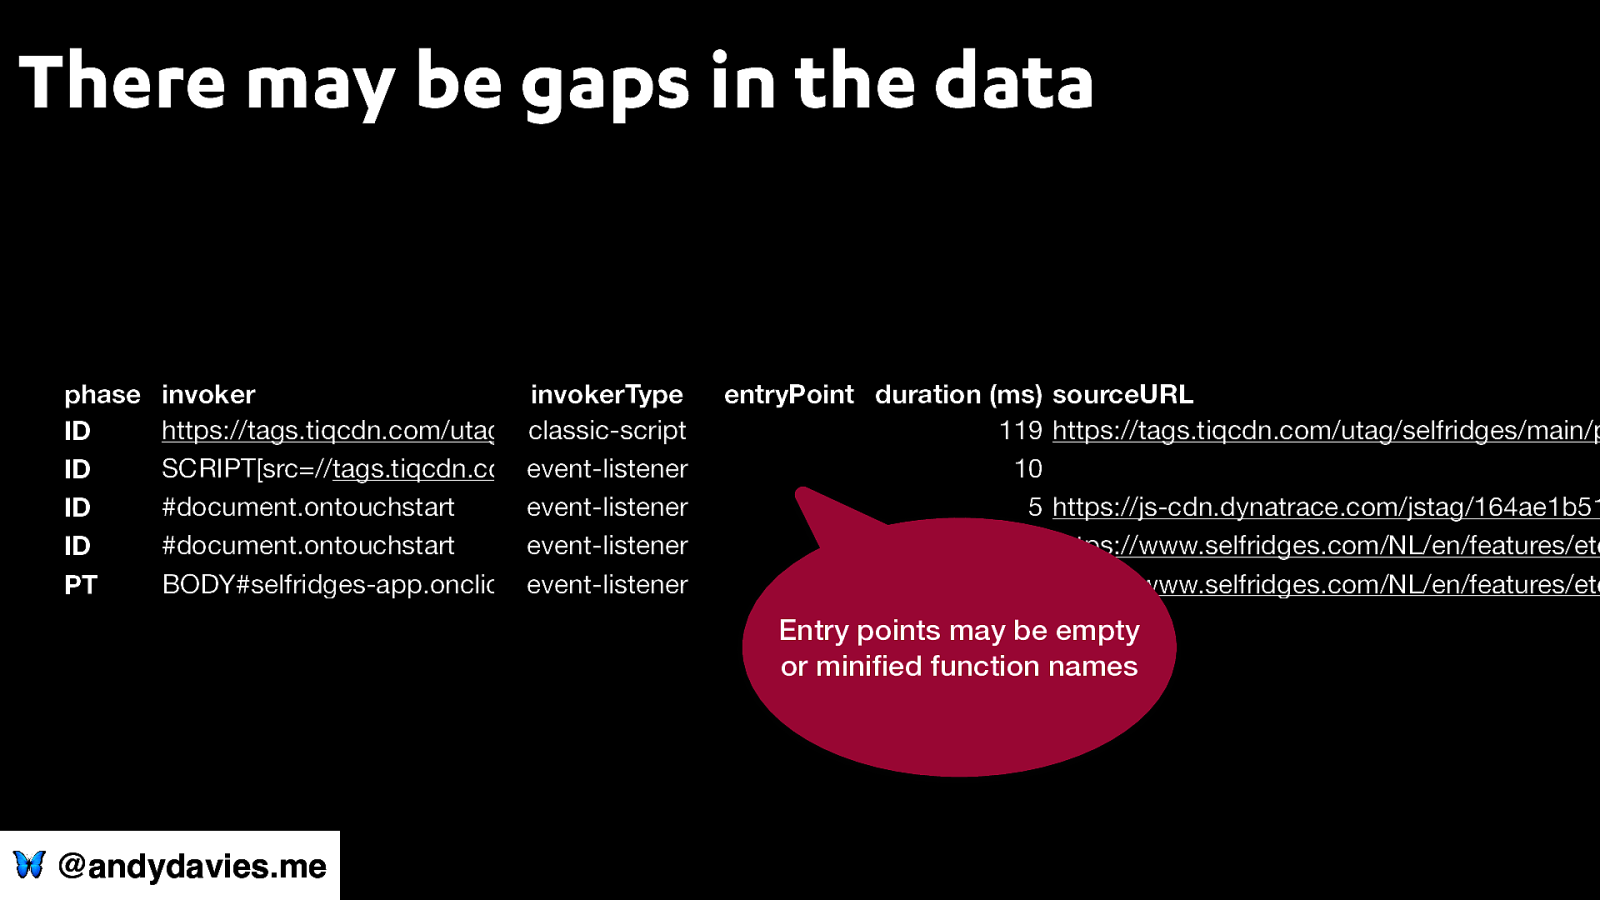
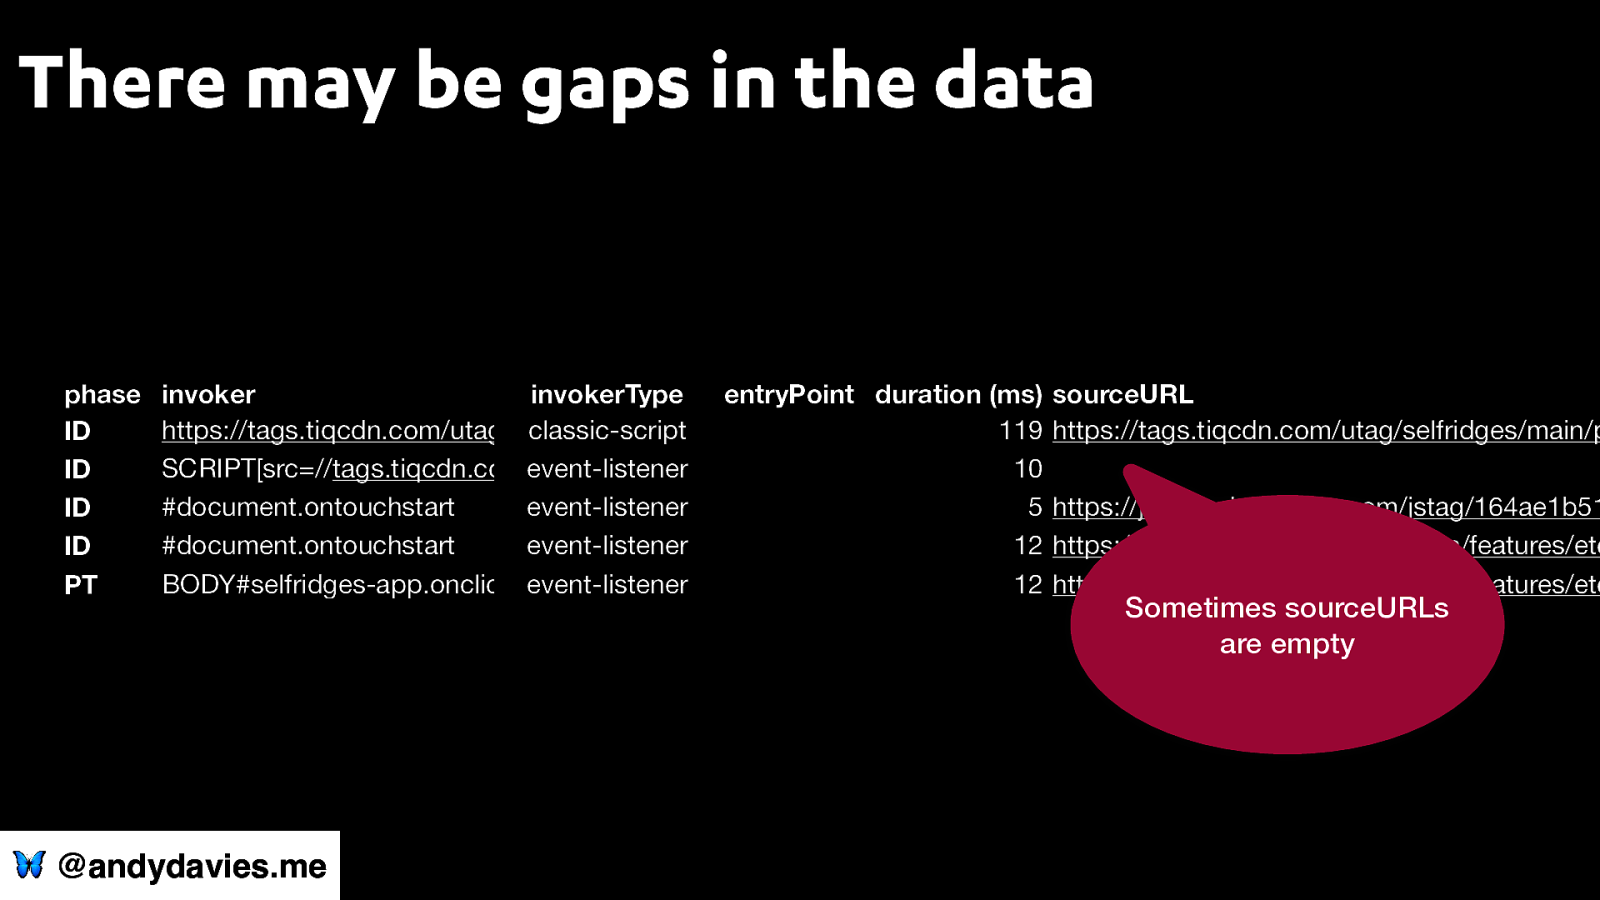
There may be gaps in the data Table 1 phase ID ID ID ID PT invoker invokerType entryPoint duration (ms) https://tags.tiqcdn.com/utag/selfridges/main/prod/utag.js classic-script 119 SCRIPT[src=//tags.tiqcdn.com/utag/selfridges/main/prod/utag.js].onload event-listener 10 #document.ontouchstart event-listener 5 #document.ontouchstart event-listener 12 BODY#selfridges-app.onclick event-listener 12 🦋 @andydavies.me sourceURL https://tags.tiqcdn.com/utag/selfridges/main/p https://js-cdn.dynatrace.com/jstag/164ae1b51 https://www.selfridges.com/NL/en/features/etc https://www.selfridges.com/NL/en/features/etc
There may be gaps in the data Table 1 phase ID ID ID ID PT invoker invokerType entryPoint duration (ms) https://tags.tiqcdn.com/utag/selfridges/main/prod/utag.js classic-script 119 SCRIPT[src=//tags.tiqcdn.com/utag/selfridges/main/prod/utag.js].onload event-listener 10 #document.ontouchstart event-listener 5 #document.ontouchstart event-listener 12 BODY#selfridges-app.onclick event-listener 12 sourceURL https://tags.tiqcdn.com/utag/selfridges/main/p https://js-cdn.dynatrace.com/jstag/164ae1b51 https://www.selfridges.com/NL/en/features/etc https://www.selfridges.com/NL/en/features/etc Entry points may be empty or mini ed function names fi 🦋 @andydavies.me
There may be gaps in the data Table 1 phase ID ID ID ID PT invoker invokerType entryPoint duration (ms) https://tags.tiqcdn.com/utag/selfridges/main/prod/utag.js classic-script 119 SCRIPT[src=//tags.tiqcdn.com/utag/selfridges/main/prod/utag.js].onload event-listener 10 #document.ontouchstart event-listener 5 #document.ontouchstart event-listener 12 BODY#selfridges-app.onclick event-listener 12 🦋 @andydavies.me sourceURL https://tags.tiqcdn.com/utag/selfridges/main/p https://js-cdn.dynatrace.com/jstag/164ae1b51 https://www.selfridges.com/NL/en/features/etc https://www.selfridges.com/NL/en/features/etc Sometimes sourceURLs are empty
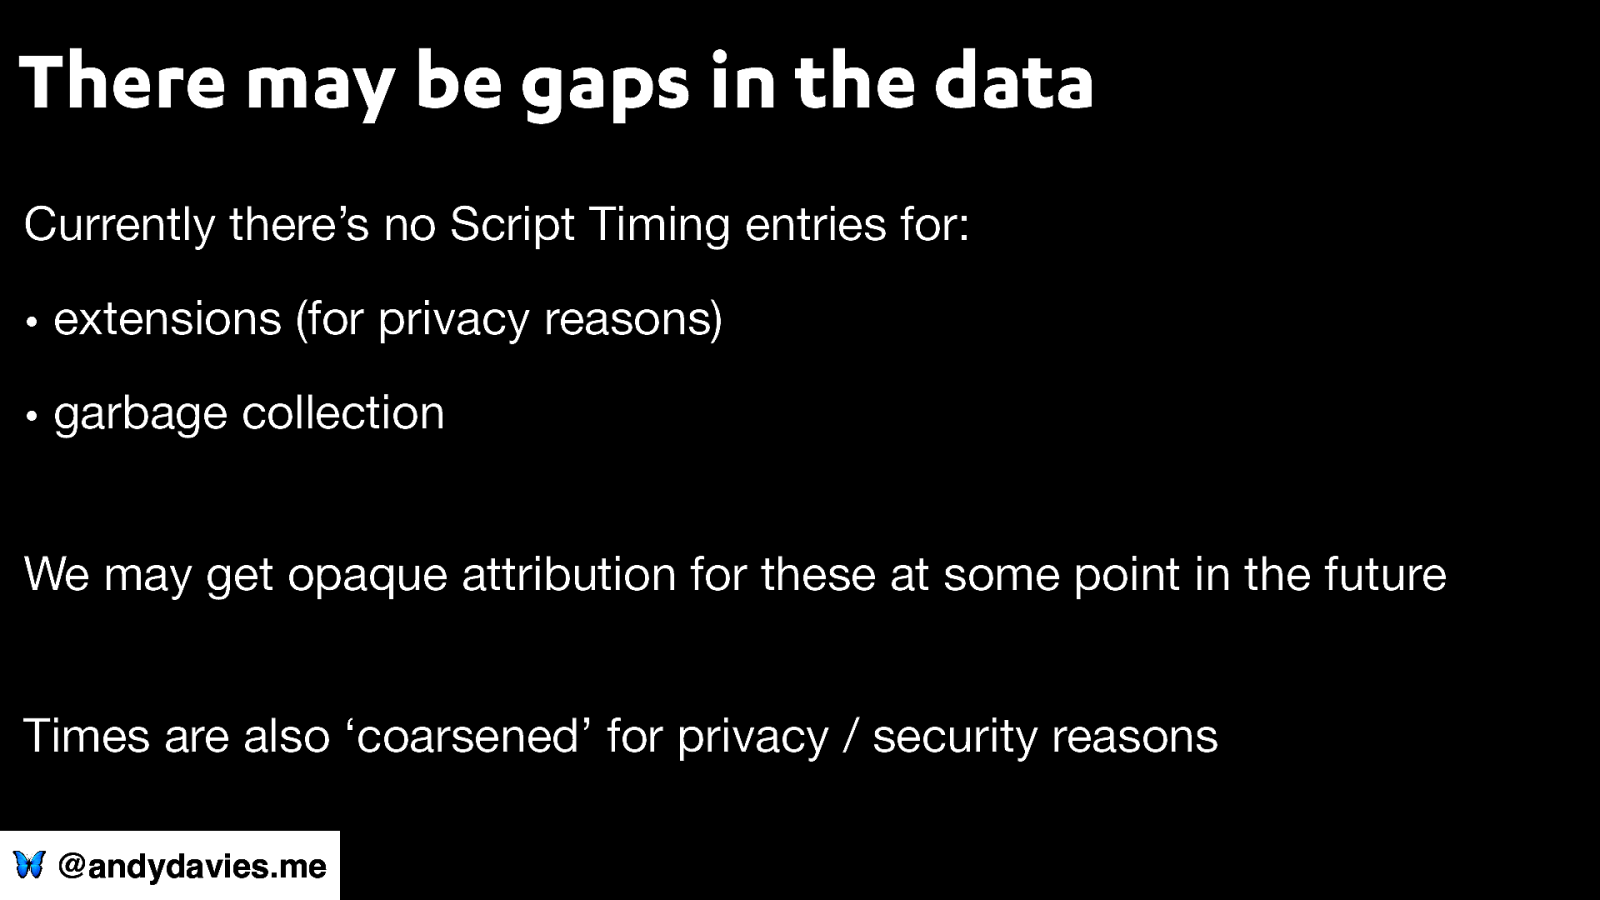
There may be gaps in the data Currently there’s no Script Timing entries for: • extensions (for privacy reasons) • garbage collection We may get opaque attribution for these at some point in the future Times are also ‘coarsened’ for privacy / security reasons 🦋 @andydavies.me
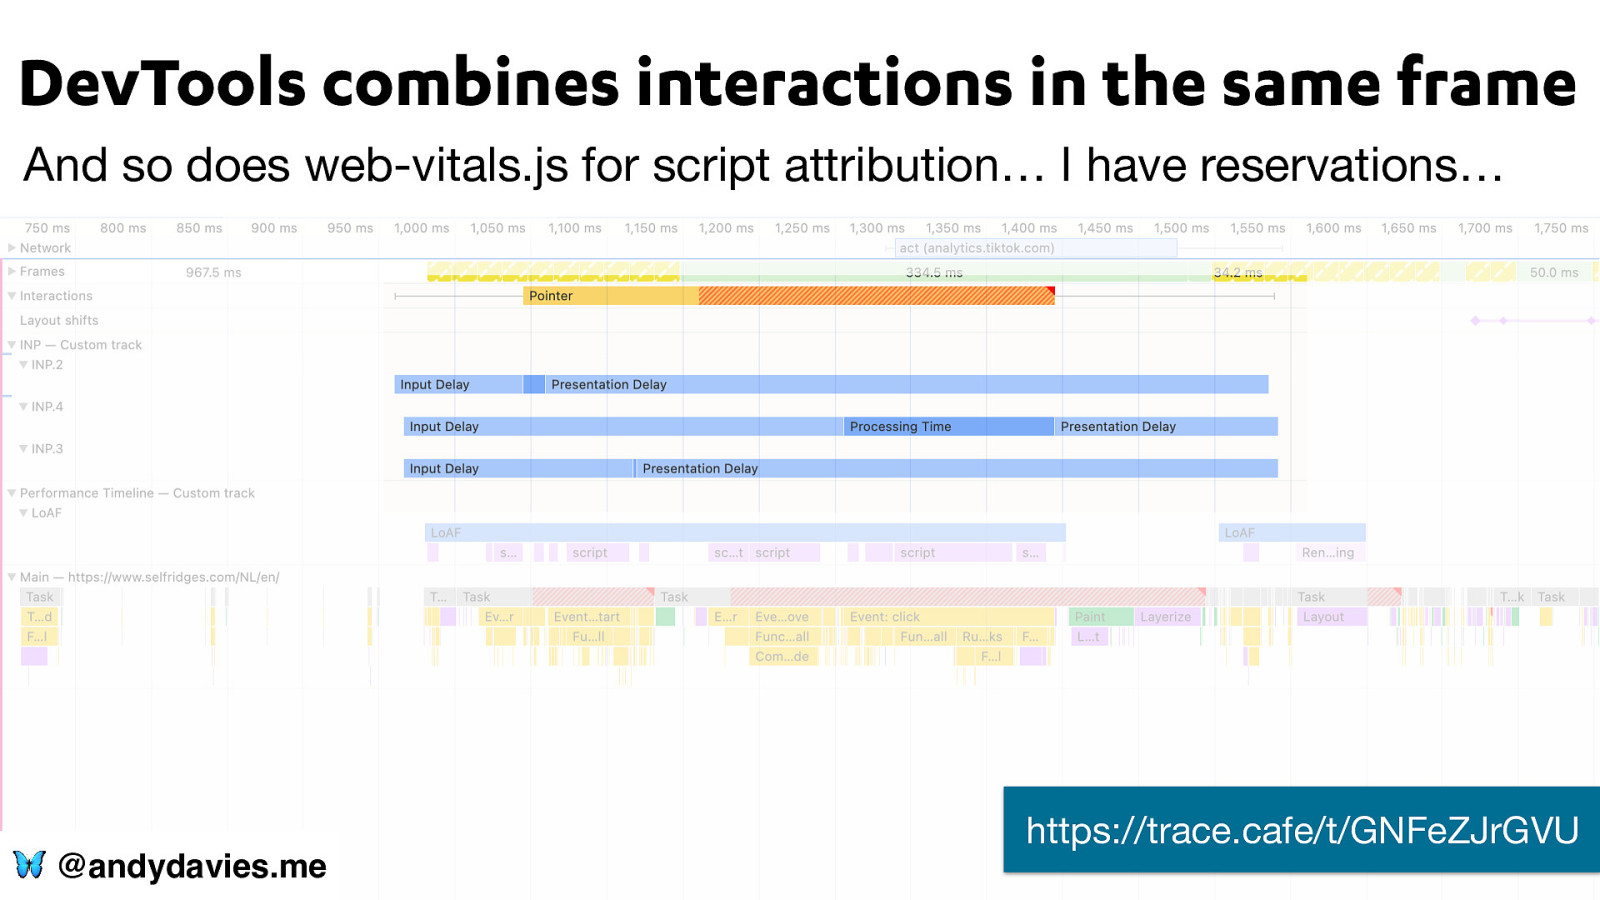
DevTools combines interactions in the same frame And so does web-vitals.js for script attribution… I have reservations… 🦋 @andydavies.me https://trace.cafe/t/GNFeZJrGVU
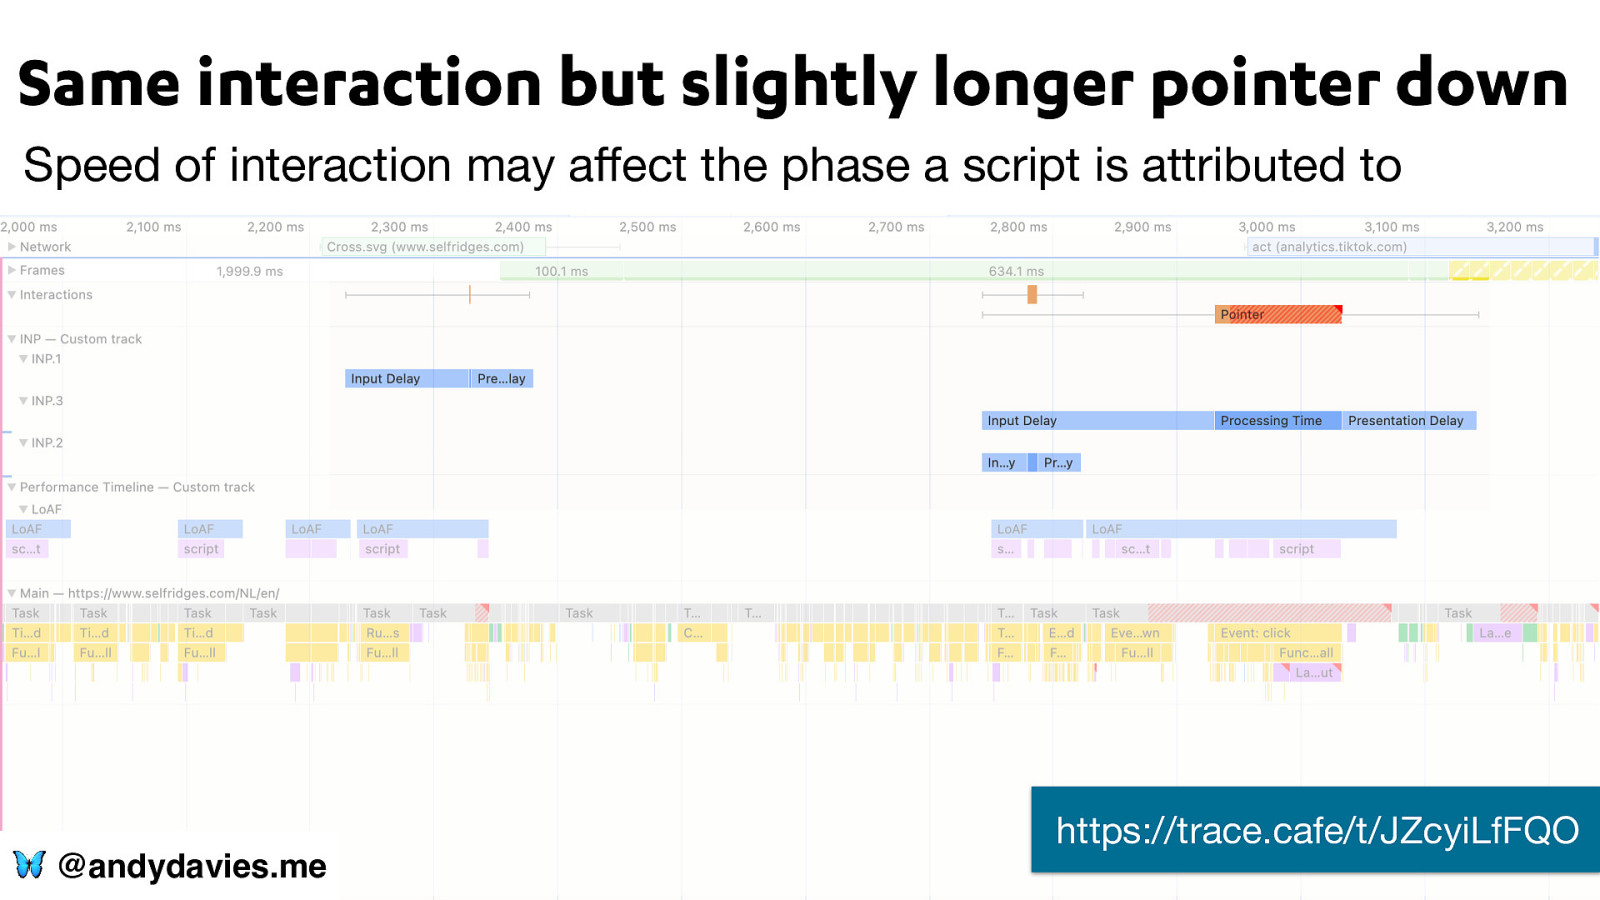
Same interaction but slightly longer pointer down Speed of interaction may a ect the phase a script is attributed to https://trace.cafe/t/JZcyiLfFQO ff 🦋 @andydavies.me
Took me a while to gure this stu out 🦋 @andydavies.me Photo by Thomas T on Unsplash
Tried visualising the data 🦋 @andydavies.me
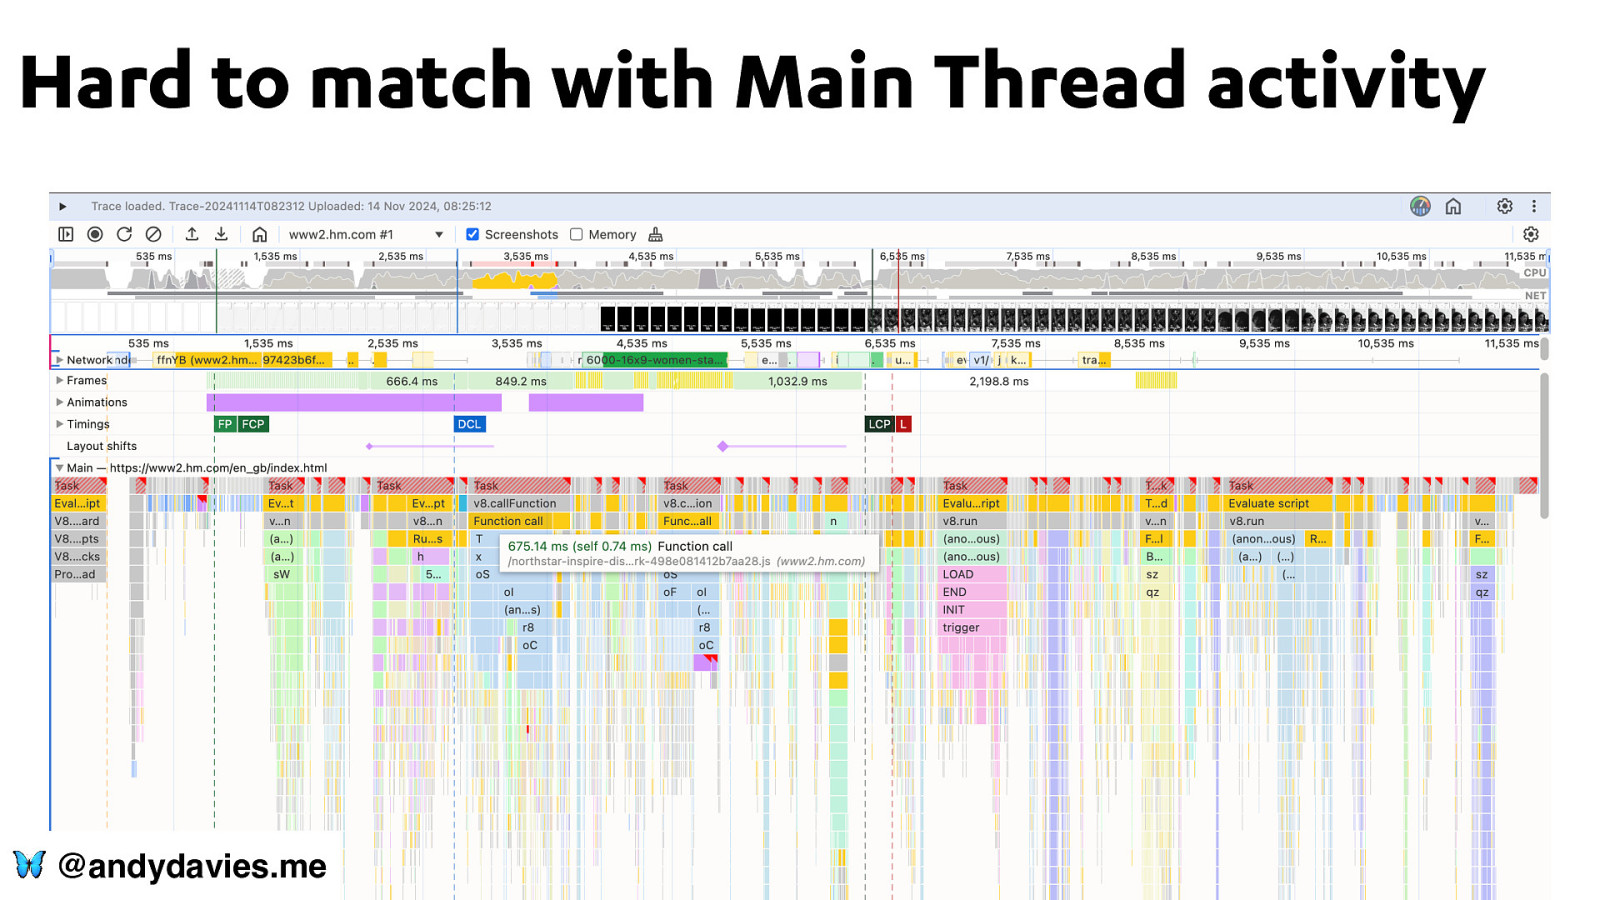
Hard to match with Main Thread activity 🦋 @andydavies.me
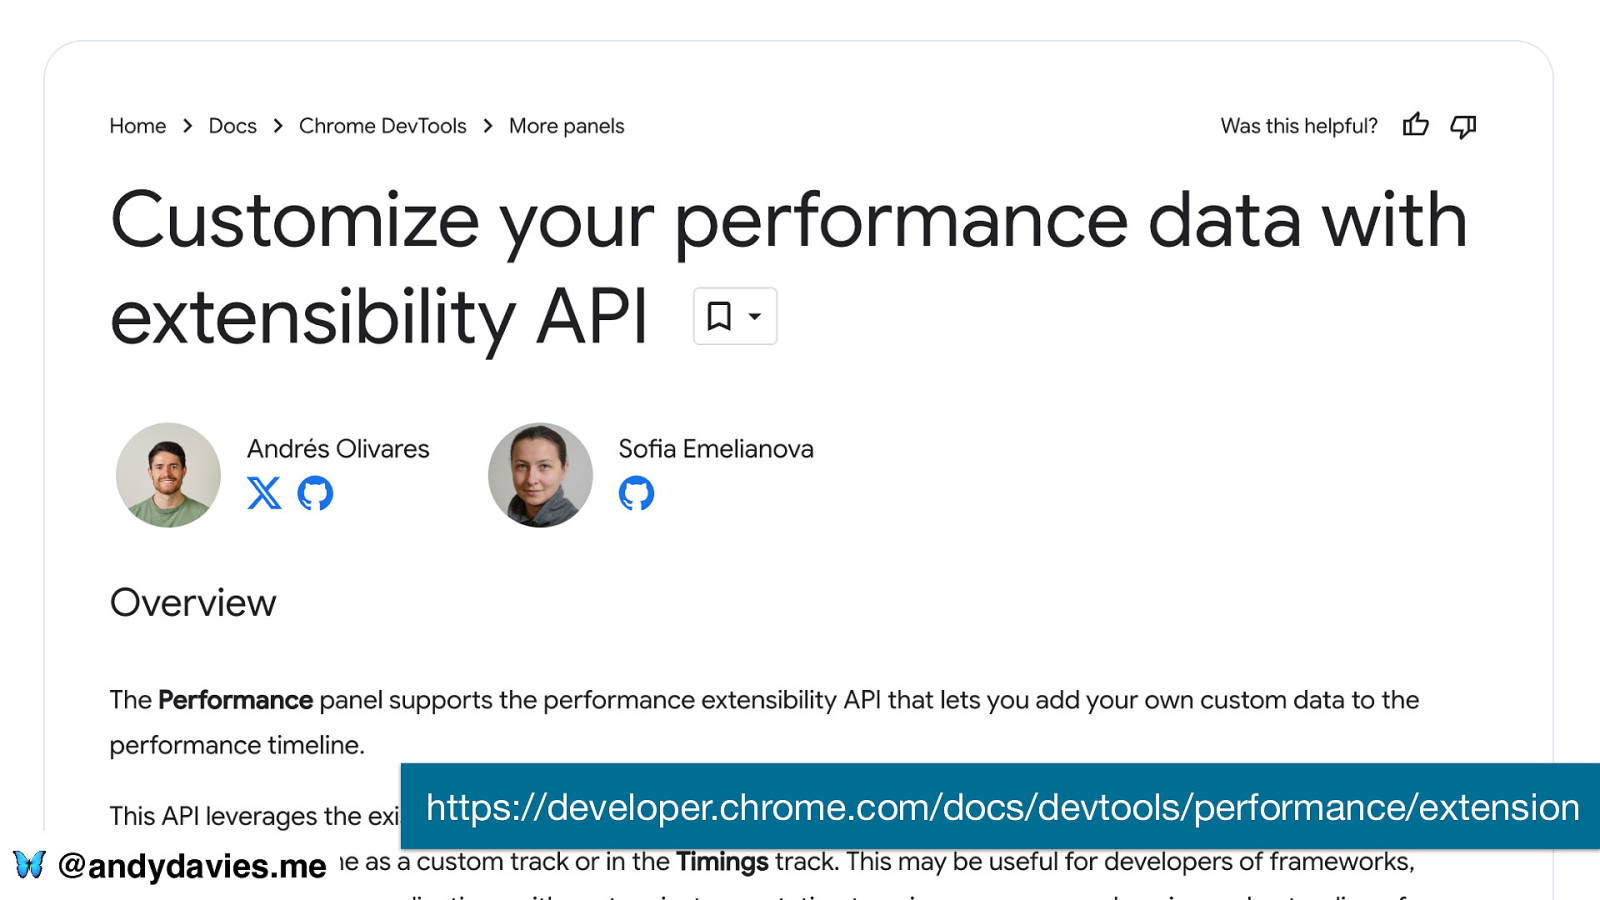
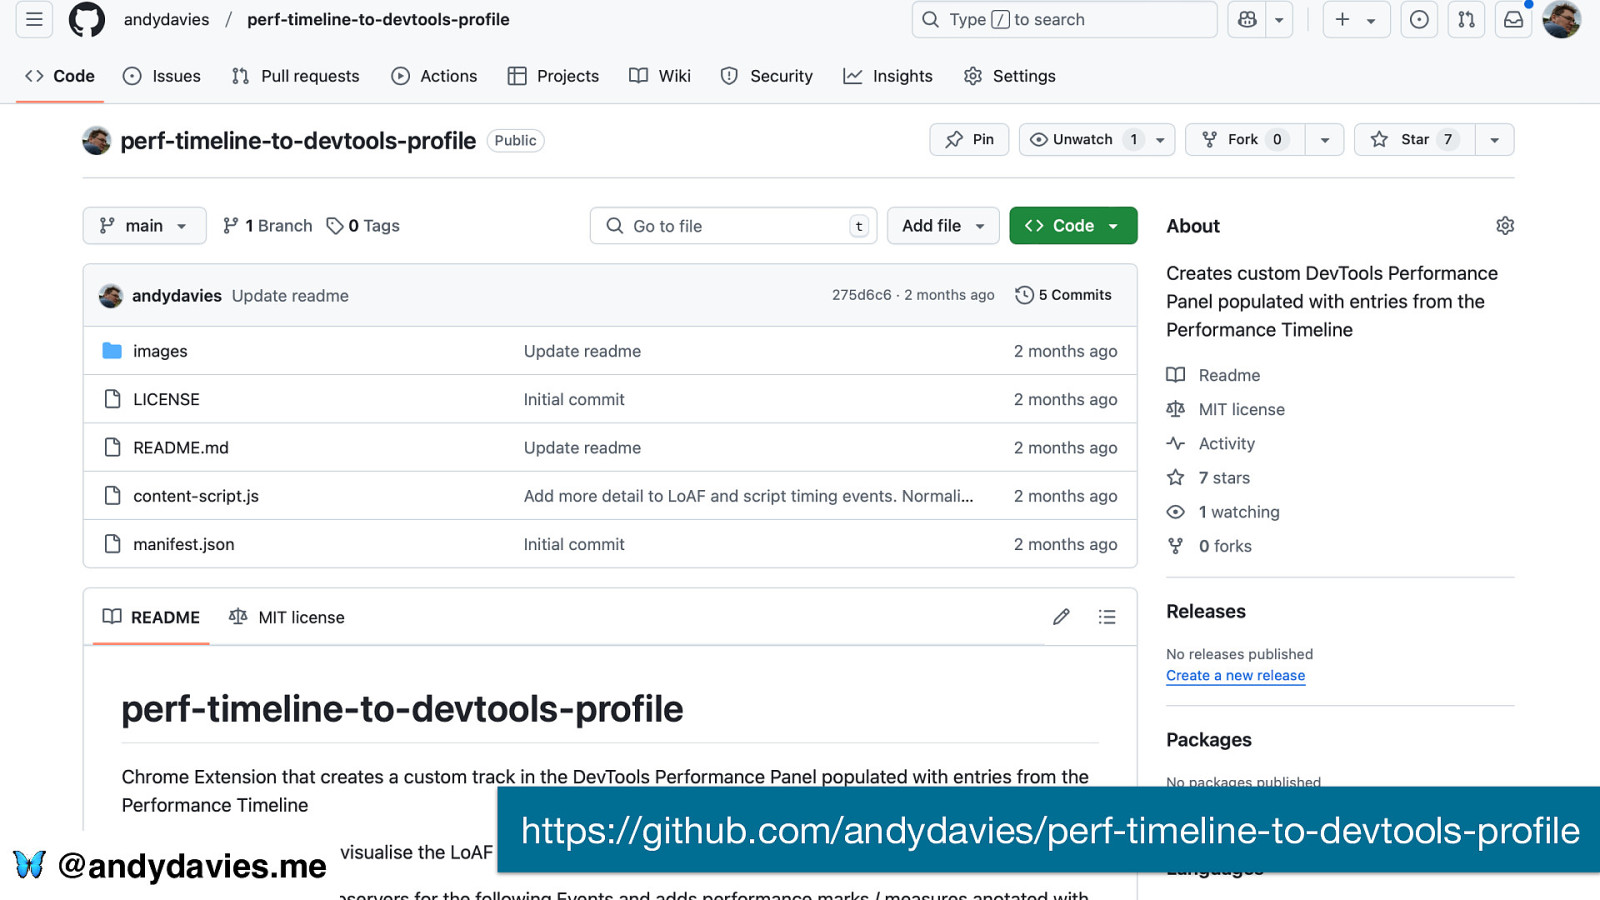
Building an Extension https://developer.chrome.com/docs/devtools/performance/extension 🦋 @andydavies.me
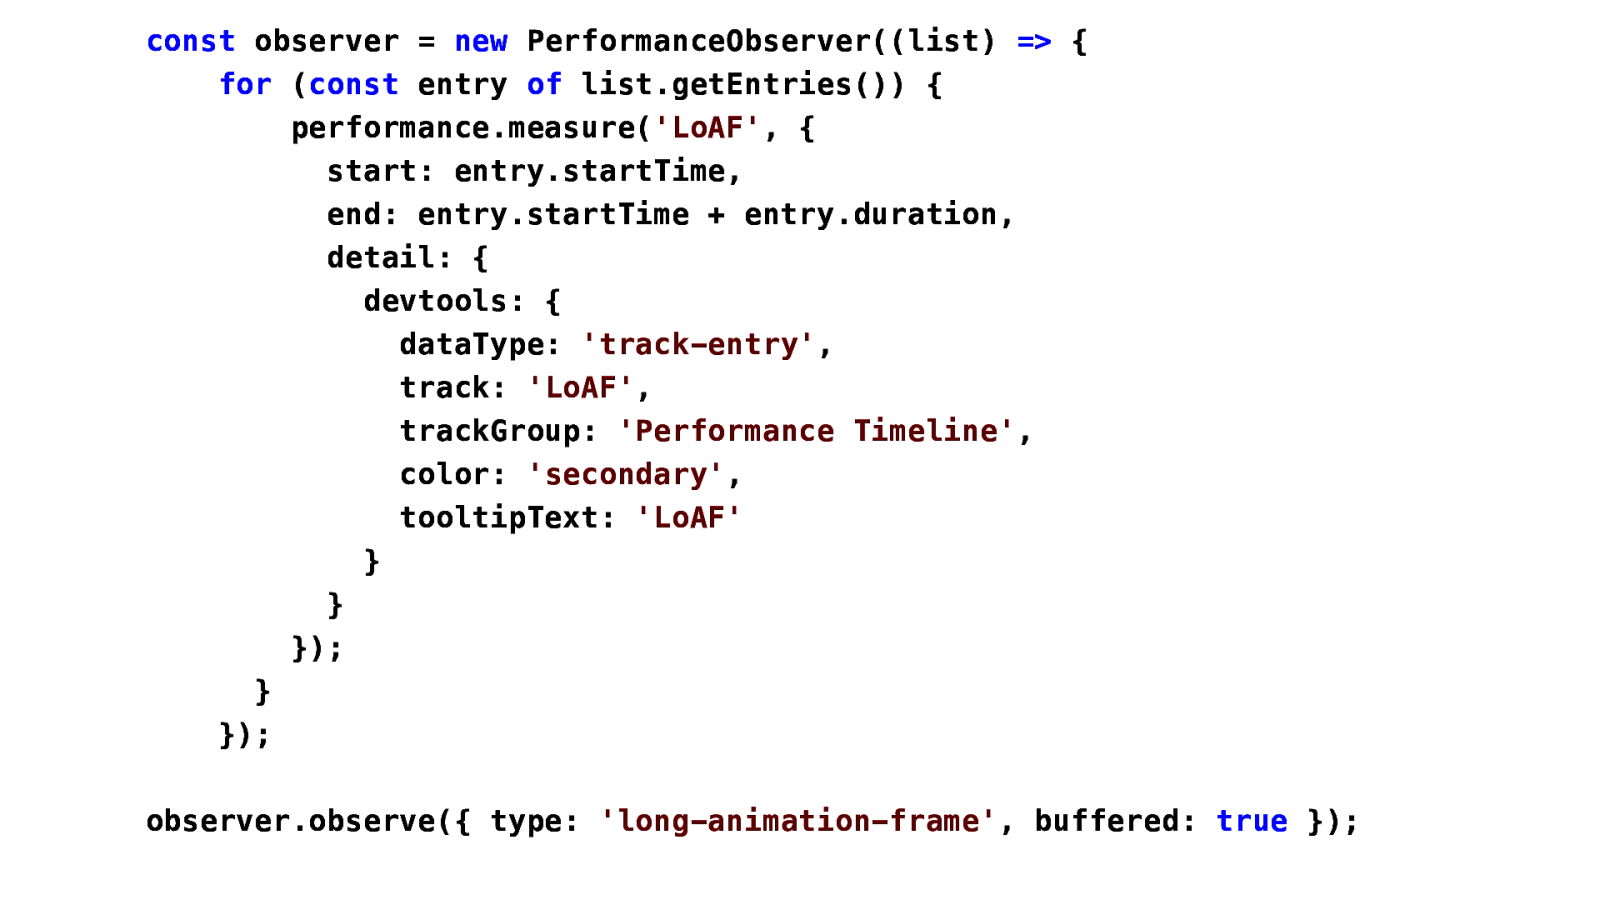
const observer = new PerformanceObserver((list) => { for (const entry of list.getEntries()) { performance.measure(‘LoAF’, { start: entry.startTime, end: entry.startTime + entry.duration, detail: { devtools: { dataType: ‘track-entry’, track: ‘LoAF’, trackGroup: ‘Performance Timeline’, color: ‘secondary’, tooltipText: ‘LoAF’ } } }); } }); observer.observe({ type: ‘long-animation-frame’, buffered: true });
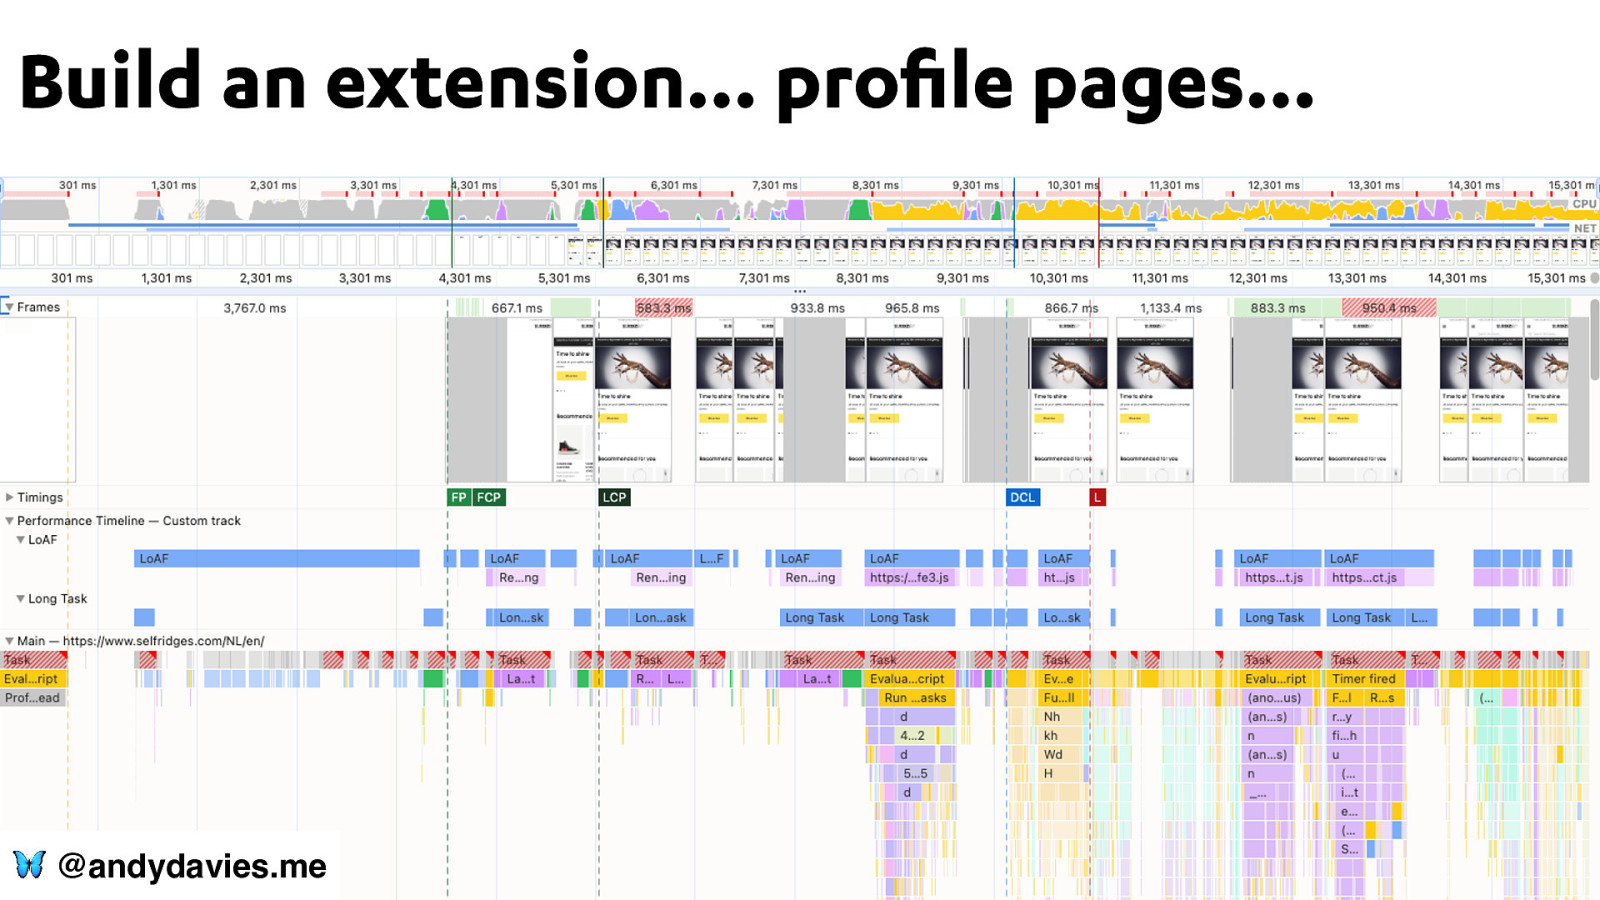
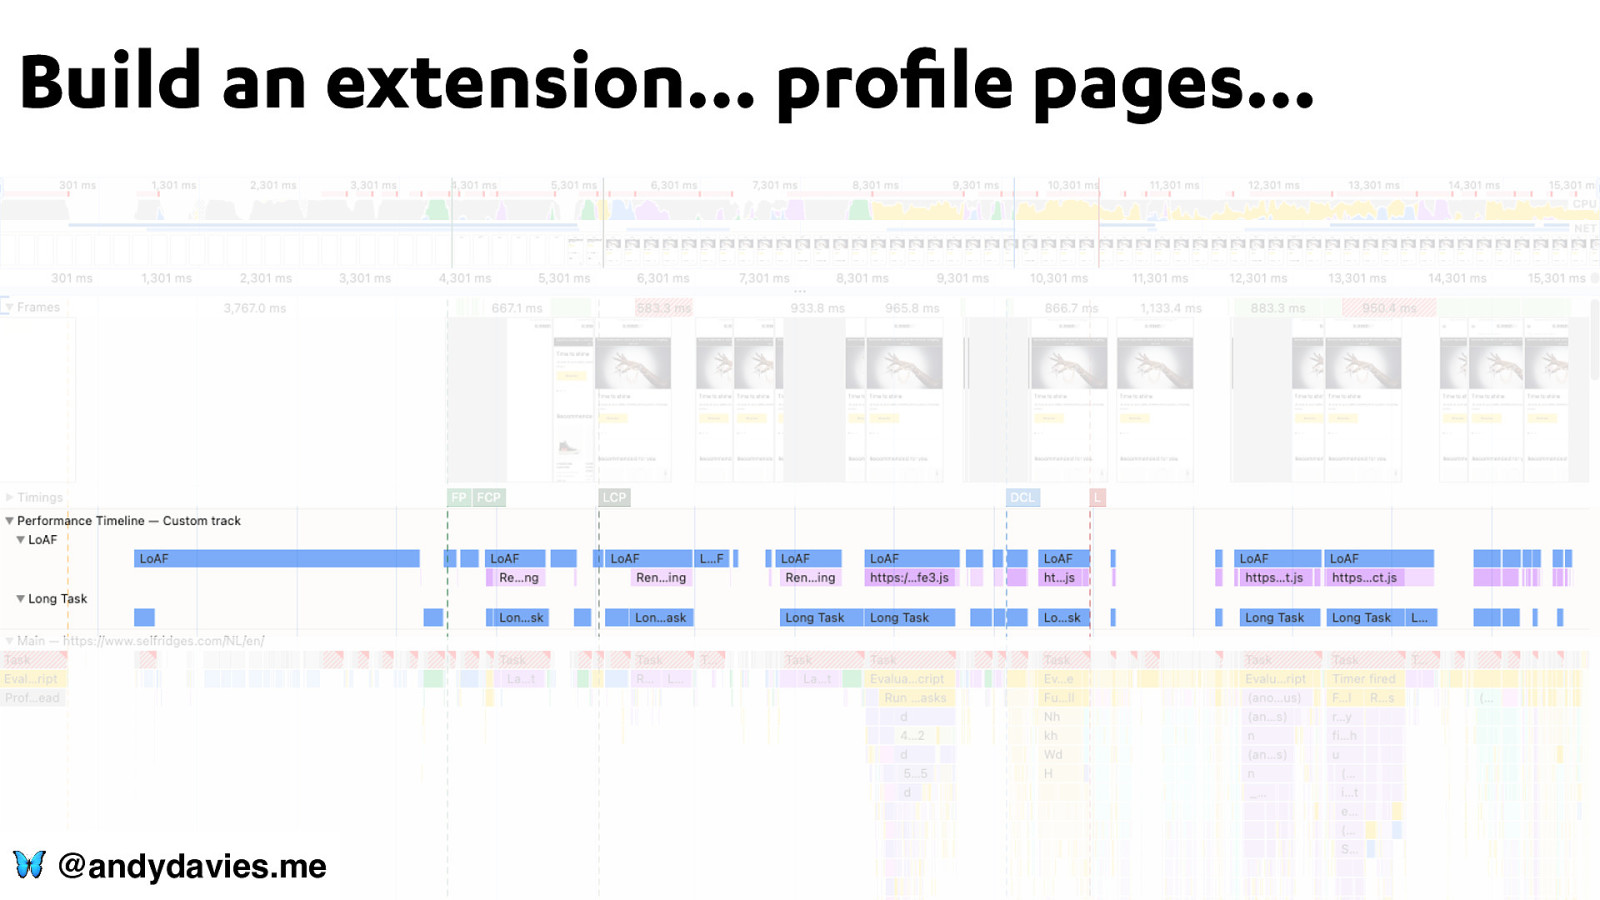
Build an extension… pro le pages… 🦋 @andydavies.me
Build an extension… pro le pages… 🦋 @andydavies.me
fi 🦋 @andydavies.me https://github.com/andydavies/perf-timeline-to-devtools-pro le
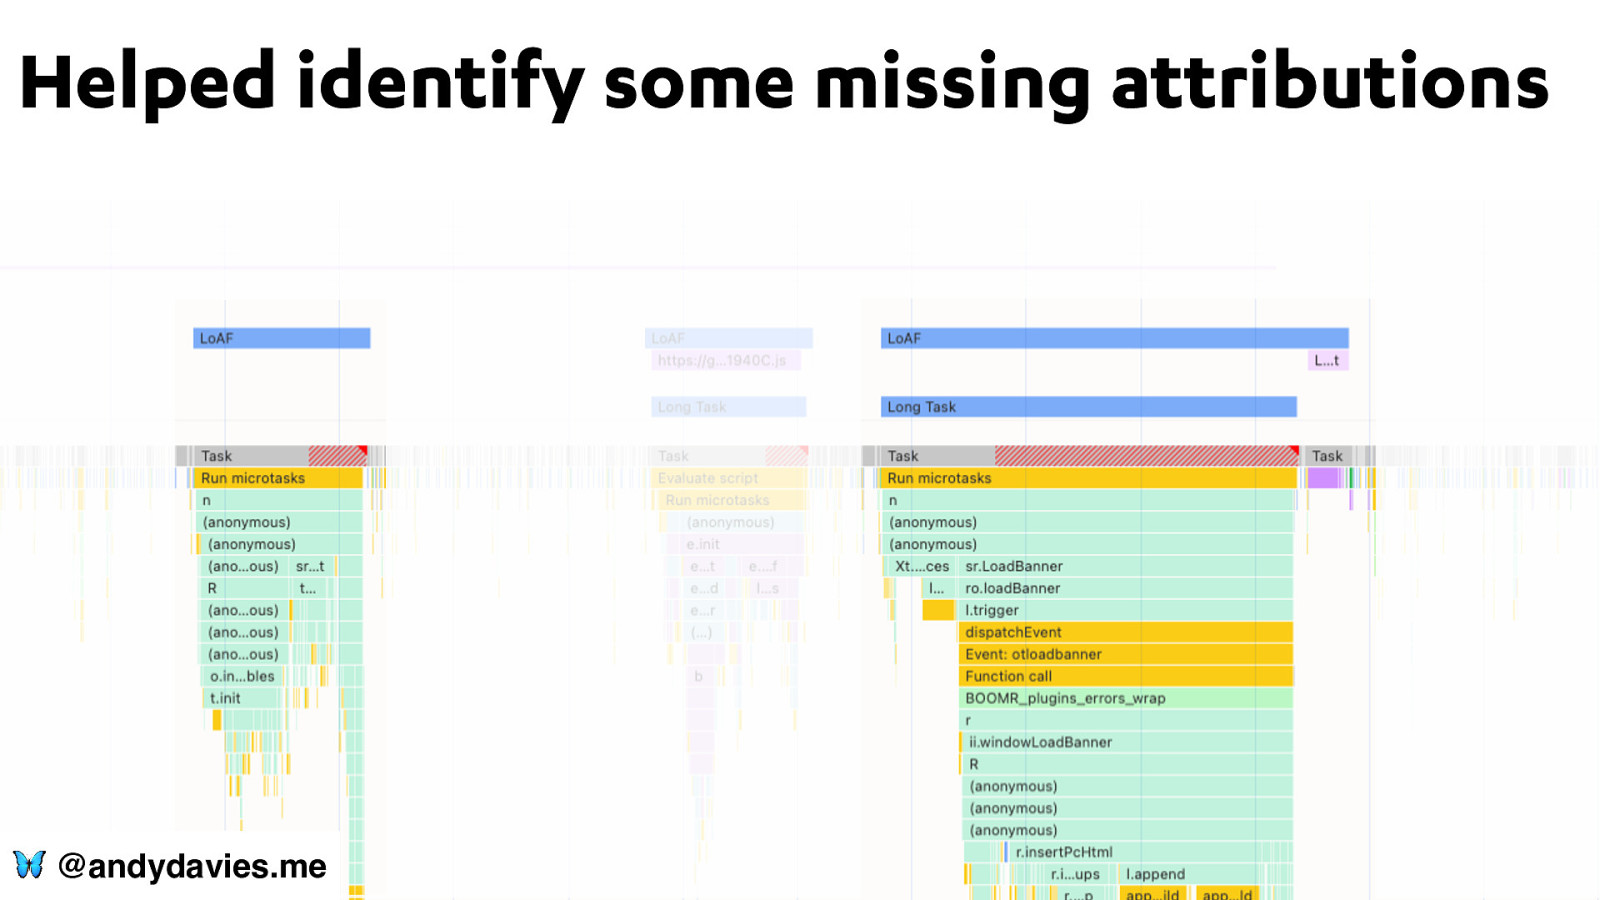
Helped identify some missing attributions 🦋 @andydavies.me
I Like Long Animation Frames They give us an insight into the runtime costs of the code we ship And allow us to indentify our problem scripts Within the context of our visitors environment 🦋 @andydavies.me
Feel like I’ve just scratched the surface… … and there’s more for LoAF to reveal 🦋 @andydavies.me Photo by Mat Ranson on Unsplash
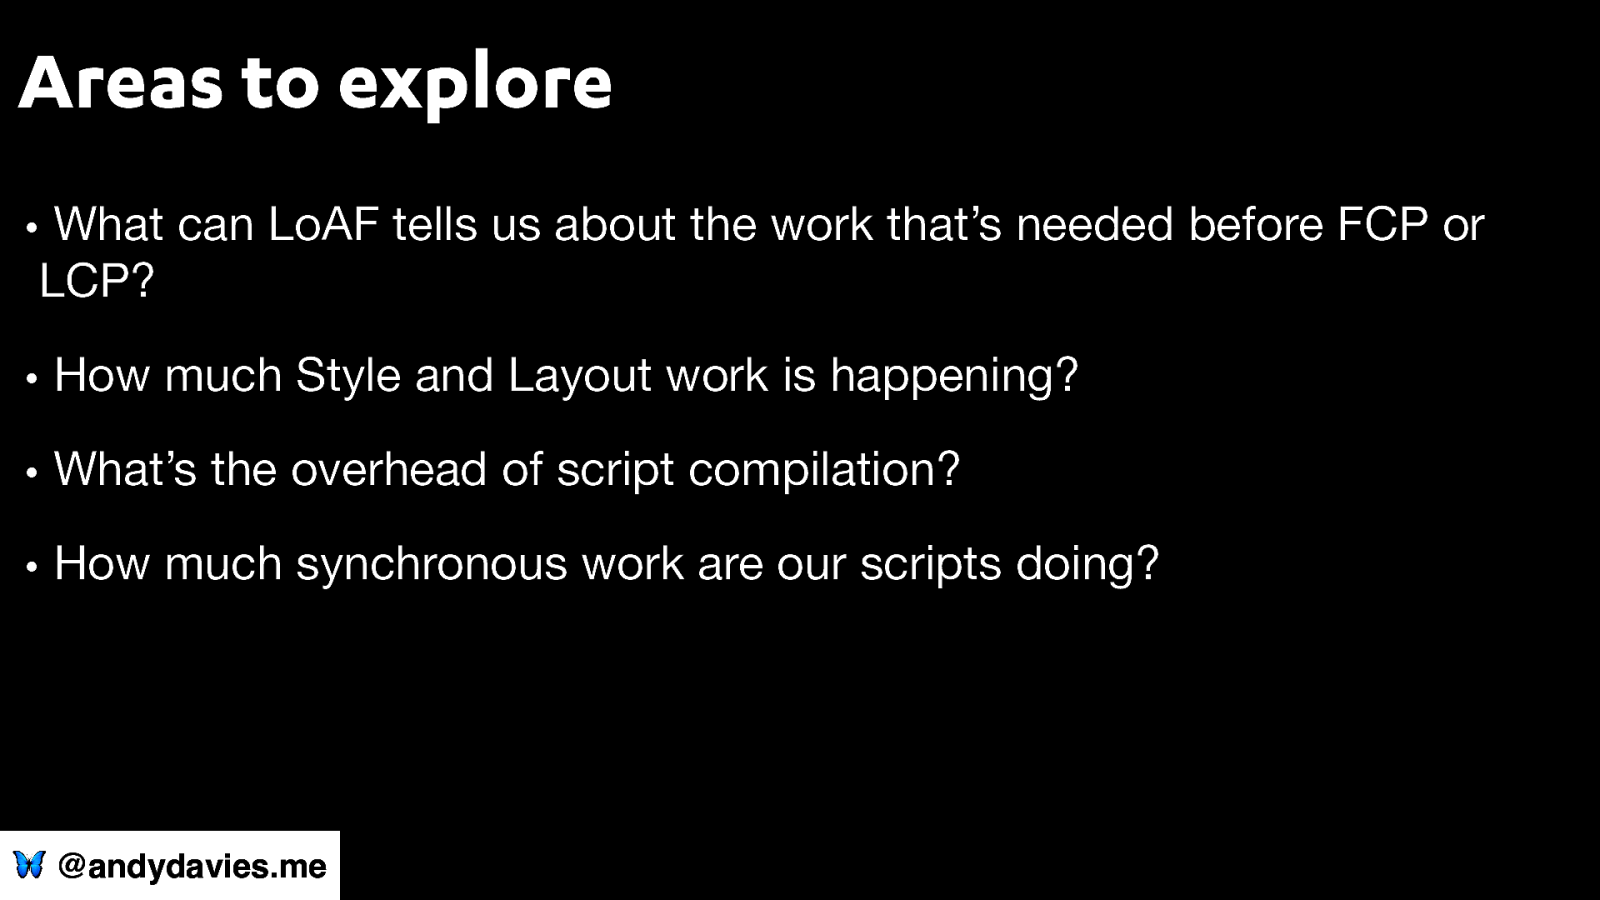
Areas to explore • What can LoAF tells us about the work that’s needed before FCP or LCP? • How much Style and Layout work is happening? • What’s the overhead of script compilation? • How much synchronous work are our scripts doing? 🦋 @andydavies.me
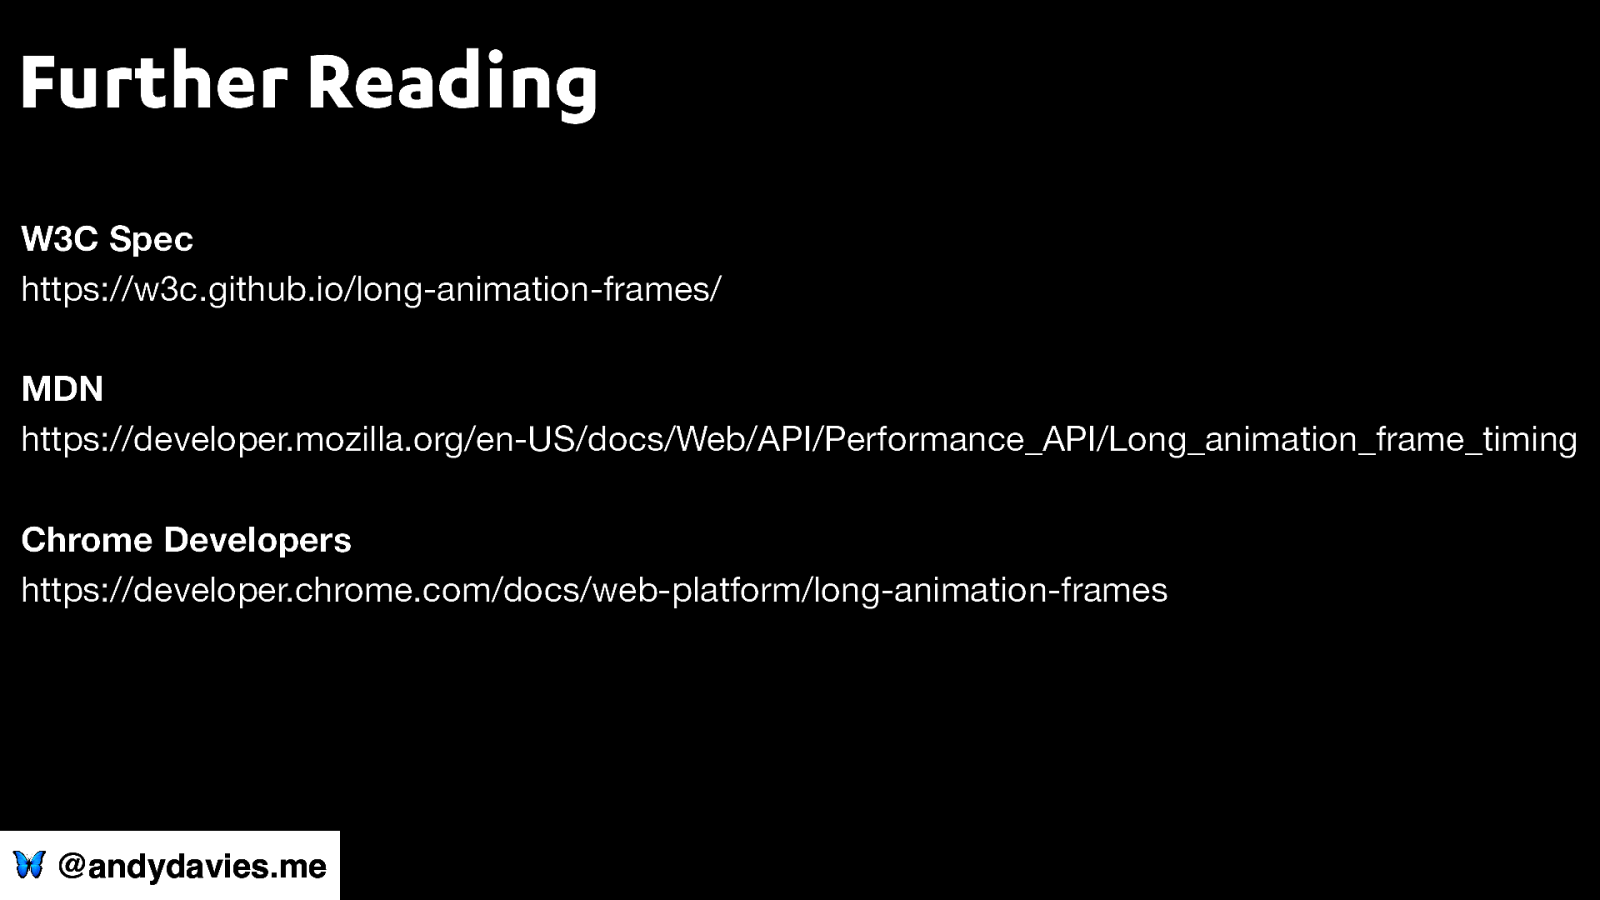
Further Reading W3C Spec https://w3c.github.io/long-animation-frames/ MDN https://developer.mozilla.org/en-US/docs/Web/API/Performance_API/Long_animation_frame_timing Chrome Developers https://developer.chrome.com/docs/web-platform/long-animation-frames 🦋 @andydavies.me
Thanks! 🦋@andydavies.me andy.davies@speedcurve.com

Over time the web has become more reliant on JavaScript… but we’ve very little information on how its growth is affecting our visitors’ experience.
Some believe JavaScript is the only way to build the modern web and dismiss the performance concerns, while others hold opposing views.
Wouldn’t it be great if we had data on how scripts actually perform in our visitor’s browsers – when they delay loading, cause jankiness and slowdown interactions, and perhaps more importantly which scripts are responsible?
After all, if we can’t measure it, how can we improve it?
The W3C Long Tasks API was a first attempt at providing this data but it only helped us to understand when the Main Thread was busy and couldn’t answer the question of why it was busy.
The W3C Long Animation Frames (LoAF) API aims to overcome the weaknesses of the Long Tasks API and provides both information on when there were long frames during rendering the process, and where possible, details on what Main Thread activity caused the long frame.
In this talk we’ll explore:
What data the API provides and how it relates to the Main Thread activity we see when profiling pages using Chrome DevTools
How we can use this data to get a better understanding of our visitors experience in the wild and identify scripts that are having a harmful impact on our visitors experience
What data the API doesn’t currently provide and how some of these gaps might be filled in the future
At the end of this talk you’ll have a good understanding of the Long Animation Frames API and how to use the data to identify scripts that need improvement.


 for free. You
can too.
for free. You
can too.